
NetWeaver Model Building Training
Introduction
This tutorial demonstrates the basics of creating a simple but complete NetWeaver model that can be used for the EMDS Introductory Tutorial. As a reminder, the problem for that tutorial was is to evaluate the current condition of subwatersheds of the Chewaucan Watershed by examining the terrestrial conditions, stream conditions, and passage conditions. Since the early 19th century, natural ecosystem dynamics in the Chewaucan basin have been disrupted by anthropogenic pressures, resulting in habitat degradation and reduced water quality, threatening biodiversity and the livelihood of local communities. With the decimation of beaver populations, key ecosystem engineers, by trappers in the early 19th century, stream processes changed. No longer regulated by beaver dams, stream energy increased, resulting in greater rates of bank erosion and downcutting. By the late 19th century, intensive grazing and logging further accelerated erosion rates and impacted watersheds (Peets, S. & Freidrichsen, T. 1999).
Concerns about water quality and the falling numbers of native salmon and redband trout in Upper Chewaucan Watershed prompted action from the Forest Service, Bureau of Land Management (BLM), and other stakeholders. Water temperatures in the watershed had exceeded the limits specified in the Clean Water Act and redband trout were under consideration for listing under the Endangered Species Act (Peets, S. & Freidrichsen, T. 1999). With their habitat fragmented by dams and populations threatened by introduced non-natives, many species of redband trout have subsequently been listed as Species of Concern (Forest Service 2011, US Fish & Wildlife Service 2011). Under the Northwest Forest Plan, the inter-agency Forest Ecosystem Management Assessment Team (FEMAT) was established to protect and restore fresh-water fish habitats throughout the region. Under this initiative, the Ecosystem Management Decision Support system (EMDS) was used by the Forest Service to evaluate the condition of the Upper Chewaucan Watershed at multiple scales and prioritize its restoration (Reynolds, K. & Peets, S. 2001).
This is the first of two tutorials from the EMDS team on building and running NetWeaver models. This first tutorial focuses on the mechanics of building NetWeaver models. The second tutorial looks at a variety of things such as 1) running NetWeaver interactively (which is very handy especially during model development), 2) key concepts and principles behind design of logic models, and 3) some of the more advanced features of NetWeaver. You can also find additional tutorials on NetWeaver at http://www.rules-of-thumb.com/tutorials.
Create a new NetWeaver Model
Initially, let's cover some terminology which we need to use. A complete set of definitions of terms can be found at http://help.netweaver.rules-of-thumb.com/doku.php?id=netweaver:terms.
Terminology
Knowledge Base:In recent times, the phrase 'knowledge base' has come into popular usage and is now generally taken to mean a body of knowledge about some problem domain. As originally used, however, the term meant something much more precise. In particular, in the original sense in which the term was conceived, a knowledge base is a formal logical representation of the entities of interest in some problem domain and their relations to one another. That is, a knowledge base is a body of knowledge that has been organized within a formal syntactic and semantic framework that allows formal inferencing about the problem at hand. We use the term, knowledge base (or its abbreviation: kb), throughout the NetWeaver documentation in this more formal sense.
By itself, a knowledge base does not actually do anything. Instead, a knowledge base is best thought of as a meta database that is used (by something or someone) to interpret data. In the case of a knowledge base system, the 'something' is an inference engine, a program library that interprets external data according to the semantics built into a knowledge base by the knowledge base designer.
One more component is needed for a complete knowledge base system because the inference engine is just a program library. This final component is the interface, a program with which the user directly interacts via screen objects in the interface to construct a knowledge base and to direct the processing of data by the knowledge base engine. The interface, in effect, acts as an intermediary between the user and the engine. During construction of a knowledge base, for example, the inference engine constructs the knowledge base in response to mouse and keyboard operations directed by the user in the interface. In the process of constructing a knowledge base, the engine enforces and constantly checks user actions to ensure that the content and structure of the knowledge base conforms to the syntax that the system requires. The user also interacts with the inference engine via the interface to control the conduct of a knowledgebase evaluation of data. In this tutorial we will be using NetWeaver Developer, the interface to the NetWeaver engine, to build the model, also known as a knowledge base or logic model.
Dependency Network: A dependency network is a formal logical representation of how system states at one level of a model are affected by, or dependent on, other antecedent states. Networks represent things such as system states and processes that are relevant to the description of the system being described by the network structure. A single dependency network is hierarchical in structure. However, NetWeaver knowledge bases generally are networks of such hierarchies. In general, a network is composed of other networks whose logical relations to the parent network are defined by relational nodes.
Node: A node is any NetWeaver object that can be connected to another NetWeaver object.
Topic: A topic is a high level node. Topics have also been referred to as 'boss' nodes due to their relationship to proxy nodes. Each topic has a unique proper name. Topics can be any of the following types, where you can get a complete definition if you click on each term:
'
![]() goal group - A
collection of goals. The goal group node generally organizes a group of goal
nodes to either compare them simultaneously or to use the cumulative effect of
the goals to build a higher level characteristic.
goal group - A
collection of goals. The goal group node generally organizes a group of goal
nodes to either compare them simultaneously or to use the cumulative effect of
the goals to build a higher level characteristic.
'
![]() goal' A topic node that contains one dependency
network. Goals test propositions such as 'the watershed is in good condition.'
We commonly use the terms goal and network
interchangeably. To tie the ideas together, a goal is designed to evaluate some
topic of interest (test a proposition of interest concerning that topic), and
its logic is specified (defined) in a network. A key property of all NetWeaver
goals is the truth value (see below) of the proposition being tested.
goal' A topic node that contains one dependency
network. Goals test propositions such as 'the watershed is in good condition.'
We commonly use the terms goal and network
interchangeably. To tie the ideas together, a goal is designed to evaluate some
topic of interest (test a proposition of interest concerning that topic), and
its logic is specified (defined) in a network. A key property of all NetWeaver
goals is the truth value (see below) of the proposition being tested.
Var Links:
'
![]() simple data link- Can hold simple data : i.e. strings, numbers
simple data link- Can hold simple data : i.e. strings, numbers
'
![]() calculated data link ' It is an
equation represented by a network of nodes
calculated data link ' It is an
equation represented by a network of nodes
Truth values: The term, truth value, originated in expert systems theory, but it has a somewhat loaded value, so you might prefer to think about it as 'strength of evidence' or degree of certainty that the evidence supports a proposition. In NetWeaver, the scale for truth values ranges from -1 to 1. In the native scale of [-1, 1], negative and positive values indicate increasingly negative or positive certainty, respectively about the truth of the proposition. In EMDS, we symbolize this same range as very low to very high evidence in favor of the proposition.
Arguments: Sometimes data that are read by NetWeaver data links during the evaluation of a knowledge base are used directly, for example, in equations. More commonly, however, data are compared to arguments to establish their truth value with respect to some proposition. Arguments may be Boolean (e.g., slope > 10), in which case the result of the comparison is simply true or false. However, most commonly in NetWeaver, arguments are fuzzy, meaning comparisons can evaluate to false, true, or some degree of trueness as discussed in the previous paragraph. Degree of trueness is often more technically described in terms of degree of set membership. So NetWeaver is basically a fuzzy logic system. Fuzzy logic is a powerful concept in modeling environmental phenomena because, in many ways, this notion of set membership is much more consonant with the way scientists and resource specialists reason about environmental phenomena.
Tutorial Task ' NetWeaver
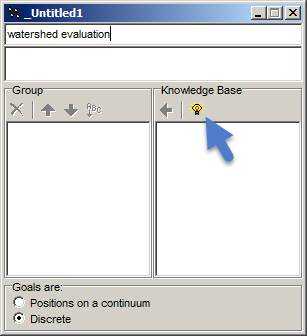
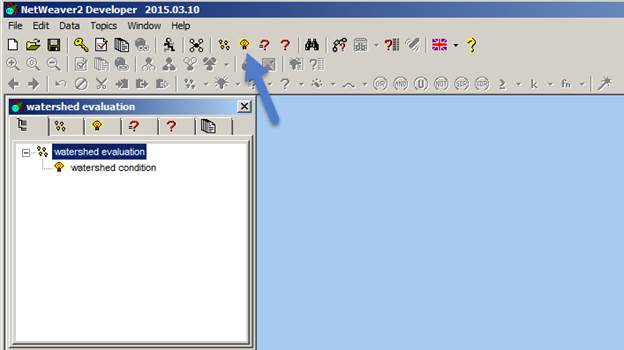
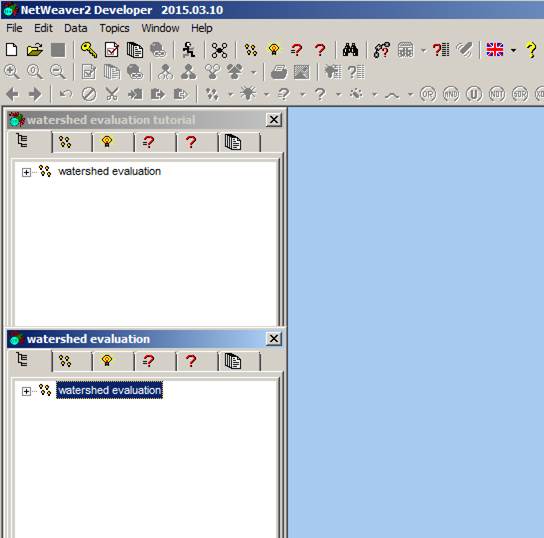
Launch NetWeaver Developer. Note that we will normally just refer to NetWeaver for brevity. Upon launching, you will see a blank screen as shown below. We will start building our NetWeaver knowledge base to assess watershed condition directly from here.
Add a
descriptive name to the new knowledge base.
Click on the File Menu, and click on Properties. For the knowledge
base name enter 'watershed evaluation tutorial.'
Click the blue check mark and then click the X in the title bar to close this dialog. The description is now displayed across the top of the NetWeaver project window.
Create a goal group
We will start by creating a goal group. Click the 'goal group' button as shown below.
In the dialog window, below, enter 'watershed evaluation' as the name of the goal group.
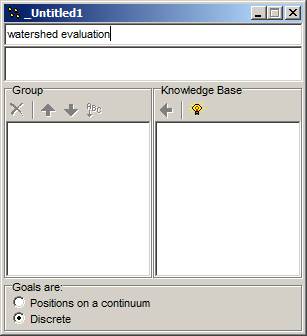
Next we will add a top level goal (which will be defined in a dependency network) by clicking on the light bulb in the knowledge base pane.
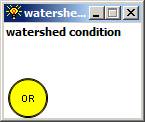
A small window opens to begin defining the dependency network for the goal. Click on the name, Untitled, to select it,
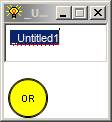
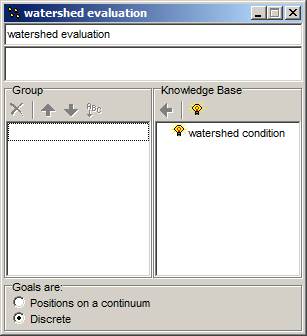
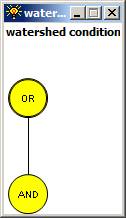
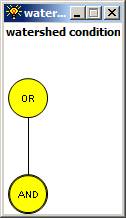
And enter the name 'watershed condition,' so it appears as in the next figure.

We could continue here, defining the logic for watershed condition, but for now, just click on the X in the upper right corner to close the goal (network) dialog.
The goal group dialog should now look like the following figure.
Next, click on the goal name that you just added to the knowledge base tab to highlight it.
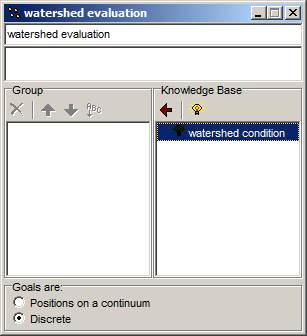
Then press the left arrow (to the left of the light bulb) to add the goal to the goal group. The goal group dialog should now look like the next figure.
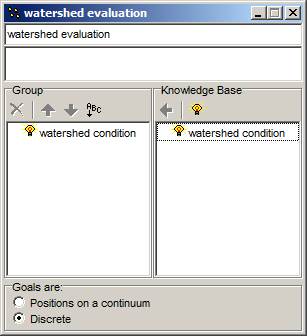
You have just added a top level goal, watershed condition, to the goal group, watershed evaluation. Click on the X in the upper right corner of the goal group edit window to close it.
Now look at the hierarchy pane in the NetWeaver project window, and click on the plus sign in front of the goal group name to expand the group. Your screen should look like the next figure.
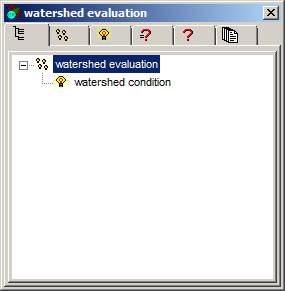
For this knowledge base, we only need the one goal group, watershed evaluation, which contains the single top level goal, watershed condition. Because our knowledge base only needs one top level goal, you may be wondering why we bothered to create a goal group to contain it. In EMDS, when a NetWeaver model is loaded into the system, EMDS always reads the model structure beginning at the level of goal groups. If there is no goal group in your NetWeaver model, EMDS will not know how to read it into the system.
Close the goal group edit dialog by clicking on the X in the upper right corner.
This is a good time to save
your new knowledge base. Click on File and then Save, and in the file dialog,
navigate to C:\Program files (x86)
\EMDS 5\sample data\ and save the knowledge base as MyChewWS2. Note that
NetWeaver will add the extension nw2 automatically.
Add a few more goals (logic networks) into the model
Next, we are going to create a few more goals that will be the children (logical antecedents) of watershed condition.
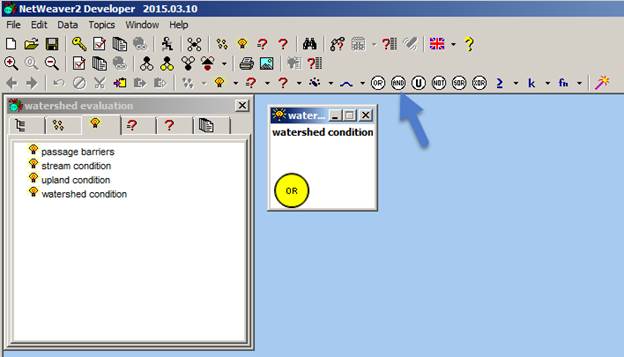
To get started, click on the light bulb in the button bar at the top of the NetWeaver window as indicated below.
A new goal is created with the name _Untitled as before.
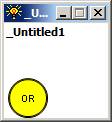
Highlight the name _Untitled, and name this goal 'upland condition.' The goal dialog window should now look like the next figure.
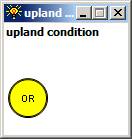
Again, we will defer defining the logic of upland condition for now, so simply close the goal dialog window.
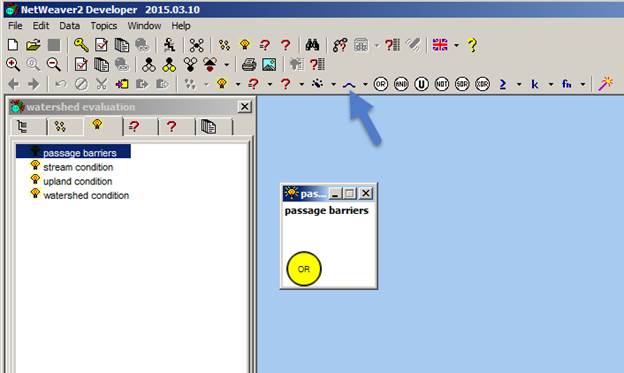
Now, create two more goals, 'passage barriers,' and 'stream condition.'
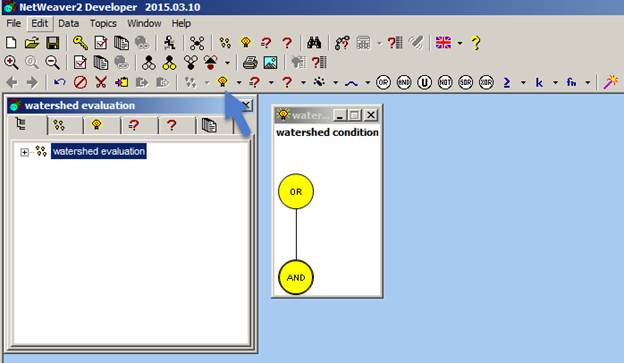
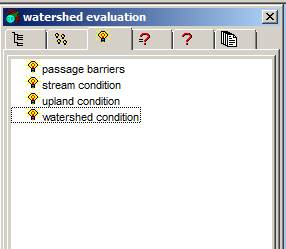
When you are finished, go to the goal tab in the project window, and you'll see that we now have a set of four goals defined in our knowledge base.
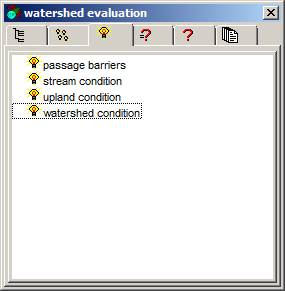
If you now go to the hierarchy tab, you'll see that it looks just as it did before. In other words, the three new goals that we just created do not show up there. They do not show up in the hierarchy yet because they are not connected to anything else in the model. They are just sort of floating about in goal soup so to speak. We'll fix that in the next step.
Adding existing goals to the logic specification of another goal
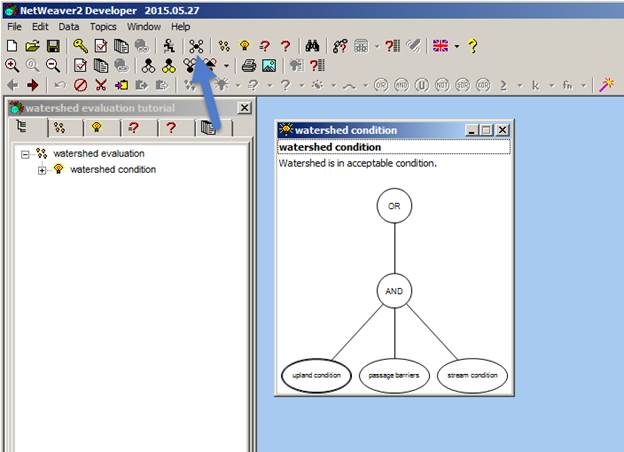
Go back to the goal tab in the project window, and double click on the goal 'watershed condition' to open its network window.
The OR node is already selected, because it has a bold highlight on it. From the top button bar, click on the AND operator (a type of node) as indicated below to add it to the specification for watershed condition.
The logic for watershed condition now looks as below.
You may have noticed that, each time you created a new empty goal, the logic always has an OR operator at the top. The OR is simply used by convention as an anchor from which to build the logic specification of a goal. The developers of NetWeaver might well have used one of several other operators as the anchor, but they decided on the OR.
Now we are ready to complete the logic for watershed condition. To get started, click on the AND node so that it is now highlighted as below.
Then click on the light bulb in the button bar as indicated below.
A menu of available goals will be displayed on the right side of the NetWeaver window.
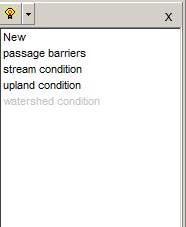
One of the options includes creating a new goal. We will come back to this later. For now, click on passage barriers, stream condition, and upland condition, one at a time. With each click, the selected goal is added to the logic for watershed condition. In particular, each goal is added to the AND operator, so your model should look like the following figure.
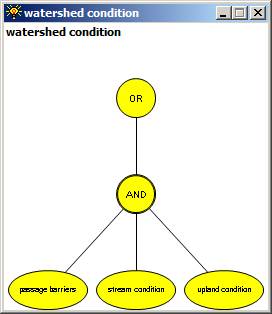
An important point here is that each addition was specifically attached to the AND because that was the currently selected node (e.g., it's bold) when you clicked on each goal to add it into the logic.
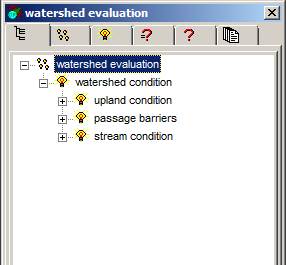
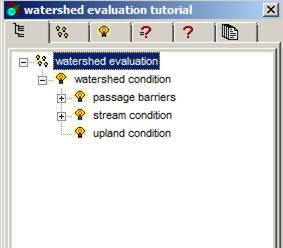
Now, let's return to the outline tab in the NetWeaver project window. Click on the plus sign in front of watershed evaluation, and then click on the plus sign in front of watershed condition. You should now see all the goals that we have defined so far, represented in the tree as in the following figure.
Close the network window for the watershed condition by clicking on the X in the upper right corner.
Also, save your knowledge base again. From here on, we'll stop reminding you to save, but we suggest that you save your work at the end of each major section of the tutorial.
Design the logic for passage barriers
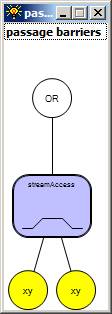
The logic for passage barriers is going to use a fuzzy node to read a data link, and compare the value read by the data link to a function defined by two pairs of xy-values. The two xy-pairs define a simple ramp function. x1/y1 will define the percent stream access that is not acceptable for fish accessibility (y1 = -1), and x2/y2 will define the percent stream access that is fully acceptable (y2 = 1). Although the two y-values are constants, the two corresponding x-values, access1 and access2, will be provided by data that are read from data links. Our ramp function is a fuzzy membership function. There are simpler ways to define fuzzy membership functions in NetWeaver as we shall see later, but fuzzy nodes are a more powerful way to define fuzzy membership functions because they are, in effect, built 'on the fly' by reading x- (and sometimes y-) terms from a database. At the end of this section, we will come back to this point.
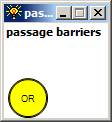
To get started, from the goal tab in the project window, double click on 'passage barriers' to open its network window. Note that you can also launch the network window for a goal by double clicking its name in the outline tab.
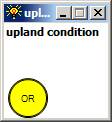
Initially, the goal, passage barriers, is empty except for the OR anchor.
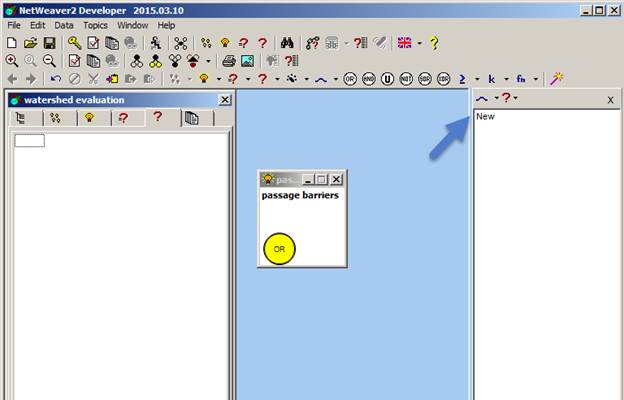
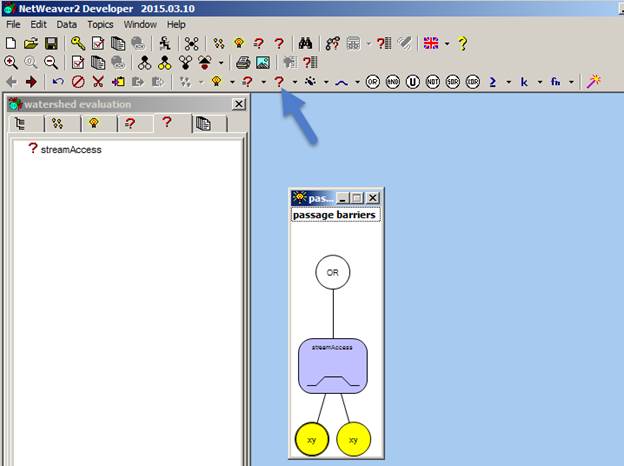
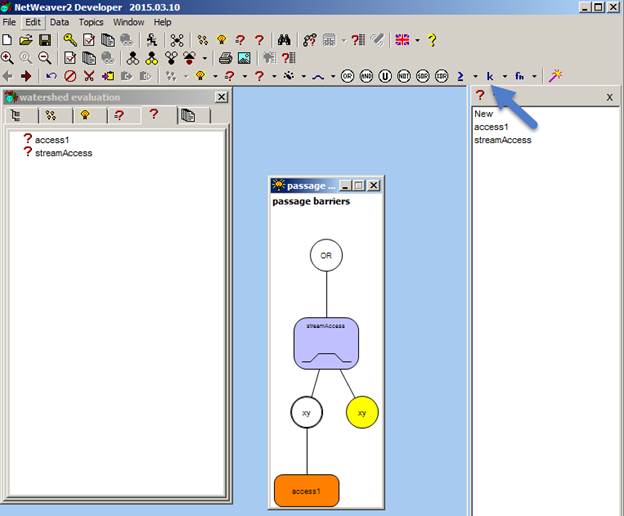
Click on the fuzzy node button in the button bar at the top of the NetWeaver window as indicated in the next figure.
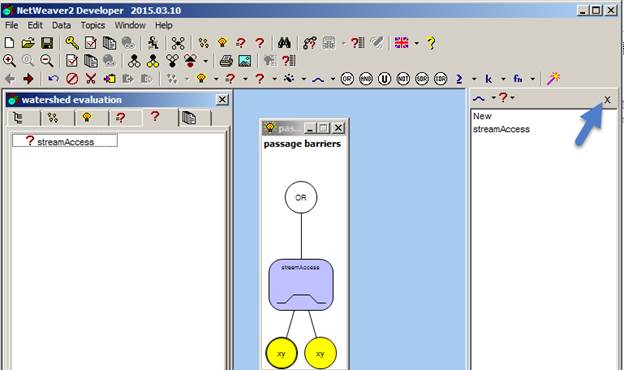
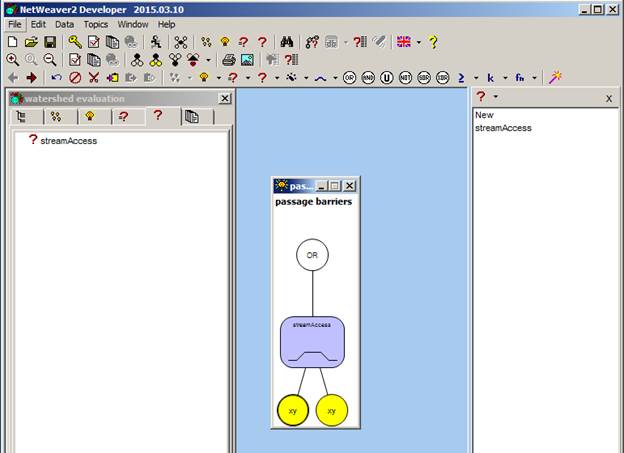
A list box opens on the right side of the NetWeaver window.
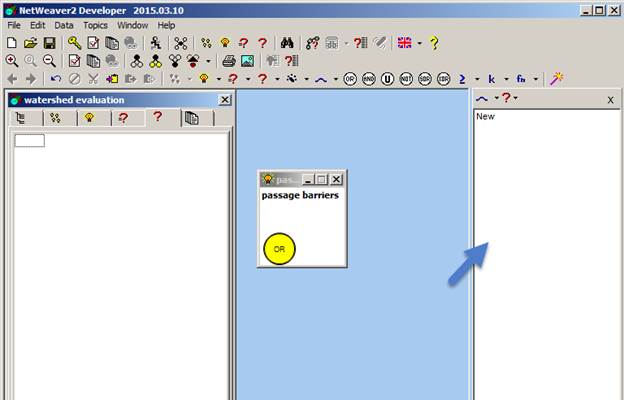
At the top of the list box, there are two icons. The leftmost indicates that we are creating a fuzzy node. The ? icon to its immediate right indicates that the list is currently set to define simple data links for use with the fuzzy node. We will discuss this convention a bit more later. For now, though, we can leave the selection for a simple data link as is. For passage barriers, the fuzzy node is going to read a simple data link named streamAccess, which we need to create. In the fuzzy node list box, click on the item 'New' in the list.
A dialog window is displayed to
name the new data link. Note that the name _Untitled is already selected. 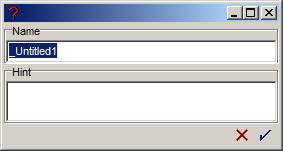
Type 'streamAccess' (without the quotes) to replace the default name. Click in the Hint field, and enter 'Percent area of the watershed that is accessible to fish.'
The data link dialog should now look like the following figure.
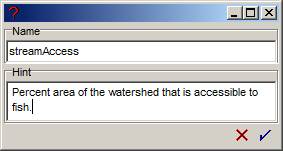
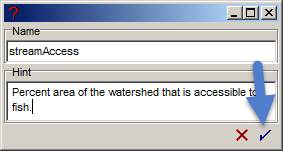
Click on the checkmark in the lower right corner to complete the definition of the data link.
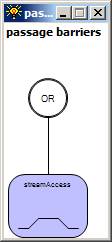
When the data link dialog closes, the network window for passage barriers is updated as in the next figure.
 .
.
For now, we will close the fuzzy node list box by clicking on the x in the upper right corner.
We now will begin adding the xy-pairs with the
access1 and access2 data links by clicking on the same fuzzy node button as before.
Do this 2 times, and the logic for passage barriers now looks like the
following figure.
Click on the left xy-node so that this xy-pair is highlighted.
Click on the question mark to create a new data link as indicated below.
The data link list box dialog opens on the right of the main window.
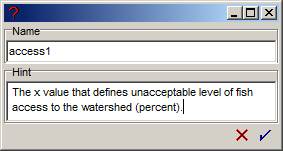
Click on the New item to create a new simple data link named access1. Click on the check mark in the lower right of the dialog to finish.
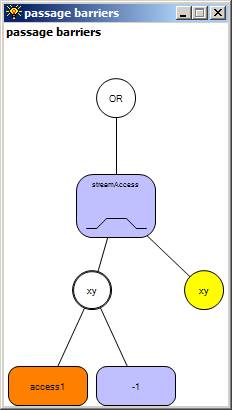
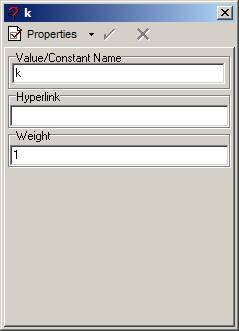
Make sure that the left xy-node is still highlighted, and then click on the 'k' dropdown on the button bar.
Select k, give it a name/value of -1, then click the check mark in the lower right of the dialog. The logic for passage barriers now looks like the following.
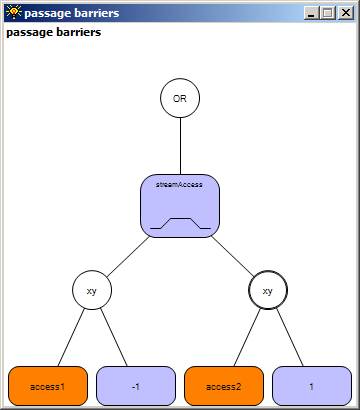
Click on the right xy-node and repeat the same steps we just went through for the left xy-pair, but with the simple data link named access2. The logic for passage barriers should now look like the following figure.
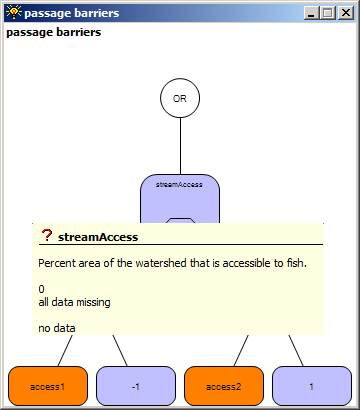
You now have a nearly complete logic specification for passage barriers. With your mouse, hover over the fuzzy node for streamAccess, and you will see the following popup. Notice the hint text for streamAccess which we added when the data link was created.
Similarly, if you hover over access1 and access2, you will see the hints entered when those data links were created. The basic guideline for data link documentation is that each should have a hint that describes the data input, including any appropriate metadata such as units (in this case, percent).
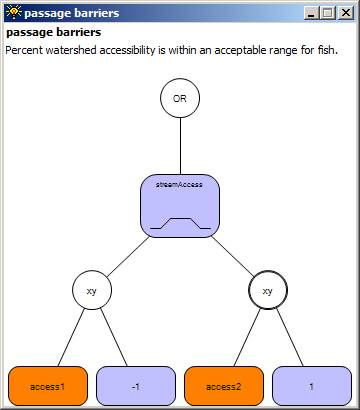
The logic specification for passage barriers is not quite complete, because we really should also state the proposition that the goal (network) is designed to test. We could have added the hint text for passage barriers when the goal was created, but we can also add it now. Click just underneath the name passage barriers, so you see the text box below.
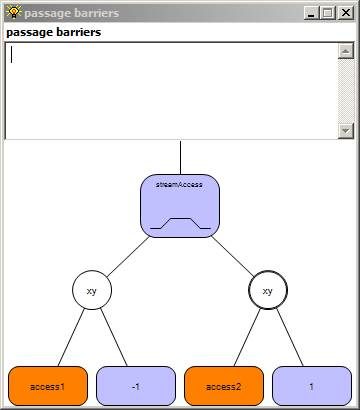
This text box is used to enter a hint for the goal. Enter something like 'Percent watershed accessibility is within an acceptable range for fish.' When you are done, the network window for passage barriers now looks like below.
NetWeaver has advanced facilities for adding as much documentation as you need to make your knowledge bases understandable to other potential users. We will return to the documentation issue later in the tutorial.
Above, we mentioned that fuzzy nodes are a more complex, but also more powerful way, for defining fuzzy membership functions. The reason that fuzzy nodes are frequently the preferred method for defining membership functions is that now the function is easily adapted to changing contextual information. For example, suppose that our analysis is intended to evaluate watershed condition across a large number of watersheds that span several ecoregions. We might want to allow for the possibility that the definition of acceptable accessibility varies by ecoregion. If this were, in fact, the case, it is a fairly simple matter in EMDS to have the parameters, access1 and access2, vary by ecoregion.
Close the network window for passage barriers.
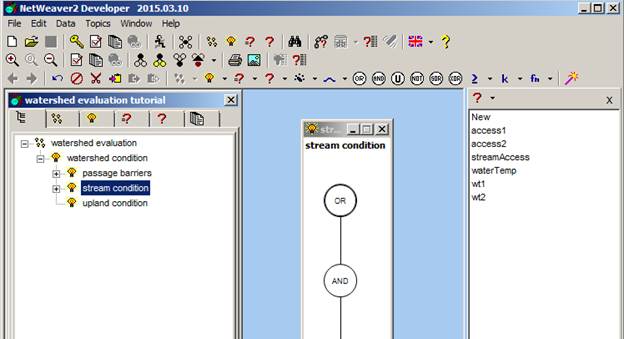
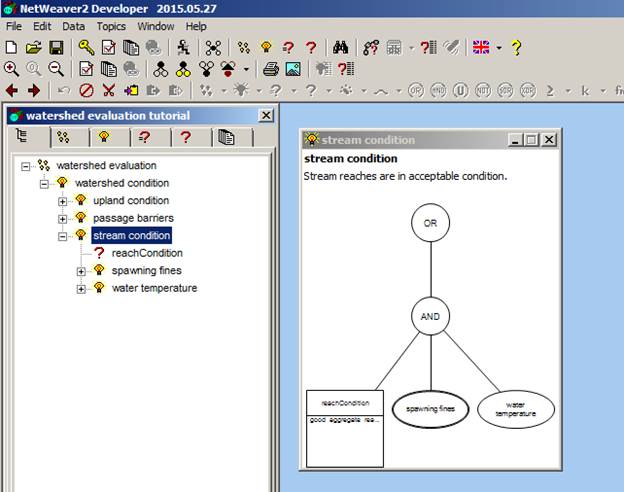
Design the logic for stream condition
The next simplest portion of the watershed condition knowledge base to define is that for stream condition. The goals considered in stream condition are the condition of stream reaches (reach condition), spawning fines, and water temperature. An interesting aspect of the goal for stream condition is that it includes a summary of knowledge base results for the evaluation of stream reaches (these are homogeneous segments of the stream network), whereas spawning fines and water temperature are watershed-level attributes, at least in this model. Thus, stream condition illustrates, in a general way, how knowledge bases can link across scales. In this example, reach condition was evaluated by another knowledge base for all stream reaches in each watershed, and the result for all reaches in a watershed was then summarized as the length-weighted average for reporting upward to the watershed-scale knowledge base.
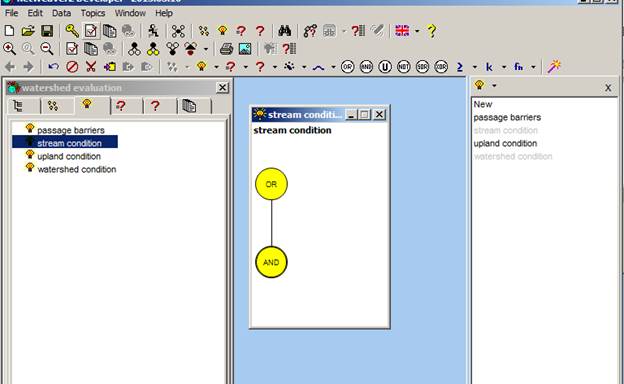
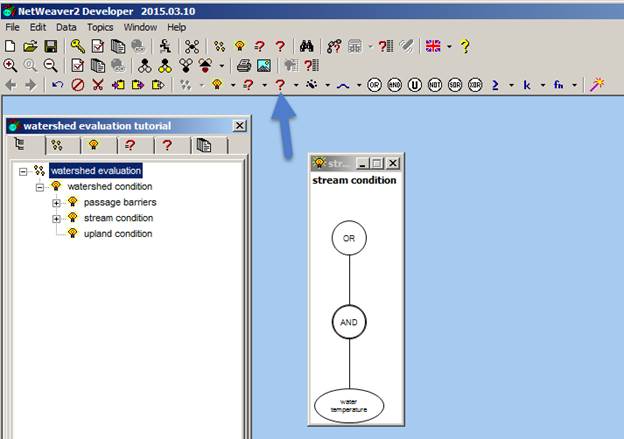
From either the outline tab or the goal tab in the project window, double click on stream condition to open the empty network.
Click the AND node in the button bar to add this operator to the network.
Click the AND node to make it the selected node.
Click on the goal node in the button bar to open the add goal list dialog. Your window should now look like the following figure.
In the goal list dialog on the right side of the NetWeaver window, click on the New item, and create the new goal 'water temperature' as in the figure below.
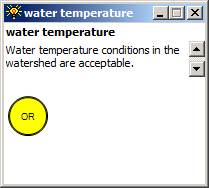
Notice that we are now entering the hint to state the proposition concerning water temperature. First, replace the name _untitled by typing over it (it comes up selected), and then click directly underneath the goal name to get the edit box to enter the hint.
The steps needed to complete the logic specification for water temperature are very analogous to what we did for passage barriers. Using passage barriers as a template, create the following network structure.
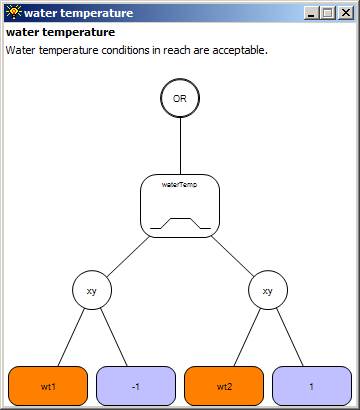
As a reminder:
1. Create a fuzzy node which will read the new data link, waterTemp.
2. Add the two xy-pairs also using the fuzzy node button (be sure that the fuzzy node is selected when you do this).
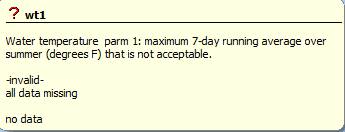
3. Create the data link wt1 to define the unacceptable value of water temperature (k = -1). See hint text below.
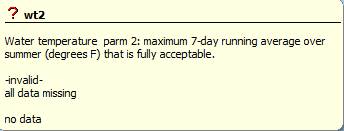
4. Create the data link wt2 to define the fully acceptable value of water temperature (k = 1). See hint text below.
Hint for wt1:
Hint for wt2:
Note also that, here, in contrast to how we created networks earlier, we are both creating new networks and inserting them into the logic for stream condition at the same time.
In the next step, we are going to add a simple data link to the logic for stream condition.
First, be sure that the AND node is selected (highlighted) in the network window.
Then click on the button to add a new simple data link as in the figure below.
The simple data link list dialog is displayed on the right side of the application.
Click on the New item, and fill in the dialog for reachCondition as in the following figure.
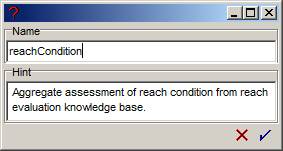
Now, click the check box in the lower right of the data link dialog window.
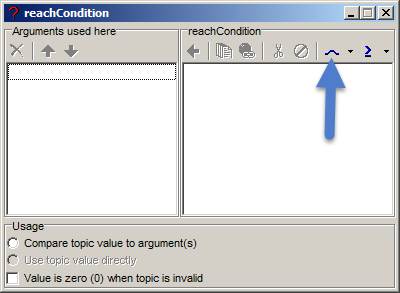
A new dialog window opens in which we will define a fuzzy argument for interpreting reachCondition.
Click on the new fuzzy argument button as in the following figure.
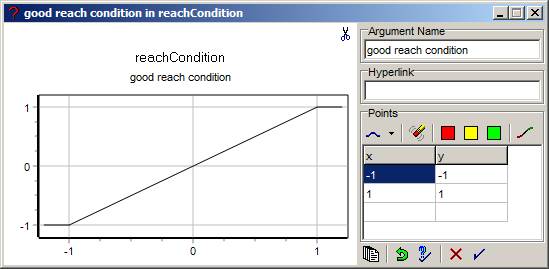
A new dialog window opens to define the fuzzy argument. For the argument name, enter 'good reach condition.' This is the proposition being tested for reach condition. In the table underneath, enter the values for x and y as shown, then click the checkmark.
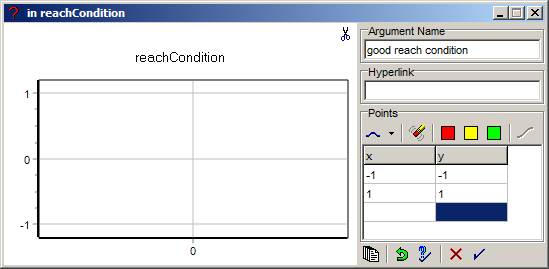
As soon as you click the checkmark, NetWeaver creates and displays the new fuzzy argument as in the next figure.
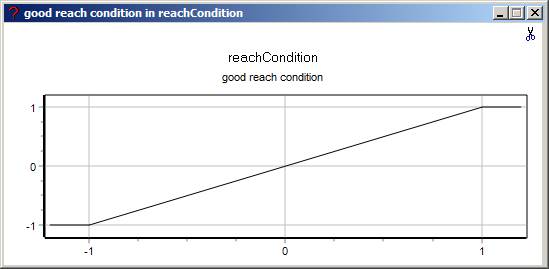
Notice that we have defined a fuzzy argument as a simple ramp function with the two xy-pairs, (-1, -1) and (1, 1). In the previous figure, you see that xy-values are entered in pairs. The definition of the function is not limited to two pairs of points.
Click on the x in the upper right corner to close this window, and now you will see the following in the main NetWeaver window.
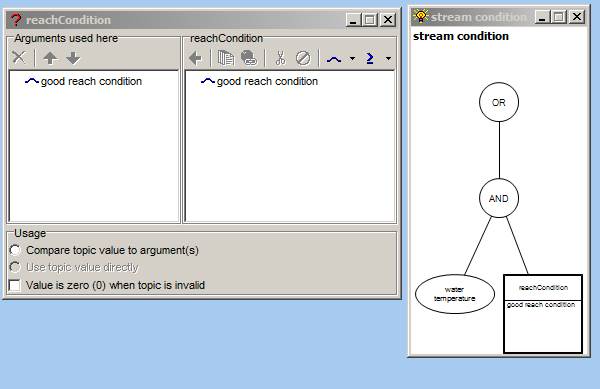
The right-hand side above shows the current logic specification for stream condition that has been developed so far (we are not done yet). Notice that a simple data link is represented by a square box in the network window. The box displays the name of the data link at the top, and lists any arguments that have been defined for use in this context. In this case, we created the argument, 'good reach condition.' The left-hand dialog is the edit dialog for the simple data link, reachCondition. It shows what arguments have been defined for it on the right-hand side, and on the left what arguments are used in the current context. We don't have an example to illustrate this in the current knowledge base, but it is not unusual in a NetWeaver model to use a data link in multiple locations in the model, and different arguments might very well be associated with different instances of usage. In other words, you define the data link object once, but there can be multiple references to it, each of which potentially uses a different argument.
Arguments do not necessarily need to be fuzzy as in this example. Using the button indicated below,
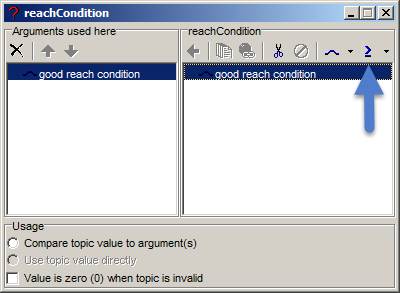
You can also enter simple arguments such as > 0.5. We'll see some examples of simple arguments later.
We said earlier that fuzzy nodes are more powerful, because those functions can adapt to context. In this example, though, we always want to use the function we created just now, so this method of specifying a fuzzy argument is simpler and faster when we don't need to worry about context.
What if you want to edit the fuzzy argument we just created? To edit the argument for the data link that we just created, right click on the reachCondition data link in the network window, and click on Arguments, and then Edit. This brings up the data link editor as below.
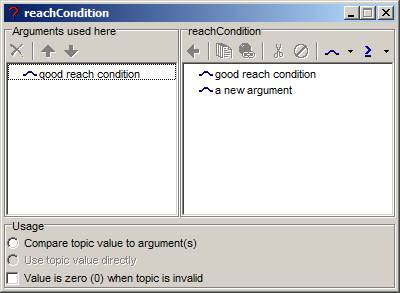
Double click on the argument in the right-hand pane to make any changes needed. Notice that the above dialog reminds you which of possibly multiple arguments are used in the current context.
If you want to edit any of the arguments defined for the data link, you can also do that from the data link tab in the project window. In that case, right click on the data link, and then choose edit.
Now, we will add one more goal named 'spawning fines' under stream condition. The spawning fines topic evaluates the percent of spawning bed area embedded with fine materials (silt and sand). Too many fines embedded in gravel reduce the amount of spawning habitat because fines fill in around the gravel substrate, preventing eggs from settling into the gravel, and making them more prone to being washed out of the gravel bed and downstream. Similar to what have done a few times, now, we will start by creating a goal named 'spawning fines,' add a fuzzy node to it that will read the simple data link, 'fines,' and append two xy-pairs to the fuzzy node. Here is a summary of the steps:
1. Click on the AND node in stream condition so it is selected.
2. Click on the goal button in the button bar (the lightbulb).
3. In the add goal dialog that pops up on the right of the NetWeaver window, click on the New item. A goal named _Untitled is added to the AND node.
4. Double click on the new goal to open its network window.
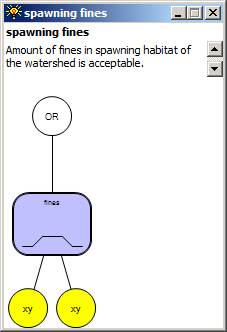
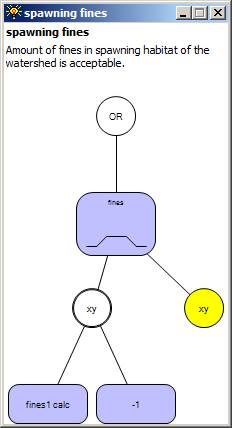
5. Replace the name _Untitled with 'spawning fines,' and add the hint 'Amount of fines in spawning habitat of the watershed is acceptable.'
6. Click on OR node in the new empty network if it is not already highlighted.
7. Click on the fuzzy node button in the button bar to add a fuzzy node to the OR.
8. In the add fuzzy node dialog (this automatically replace the add goal dialog), click on the New item.
9. In the data link dialog that pops up, change the name to 'fines,' and add the hint 'Percent spawning habitat composed of sand or silt.'
10. Make sure that the new fuzzy node for fines is selected, and click on the fuzzy node button two more times to add two xy-pairs.
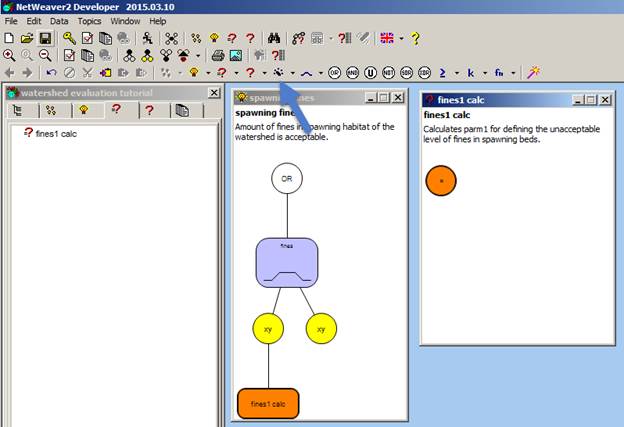
At the end of step 10, your network for spawning fines should look like the following figure.
So far, the above steps are completely analogous to how we have created fuzzy nodes previously. Now, though, we are going to do things a bit differently. Rather than add simple data links to each xy-pair, we will add calculated data links that will calculate the two x-values.
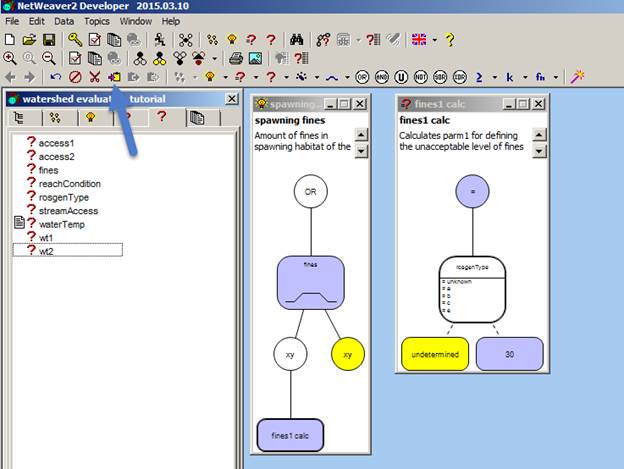
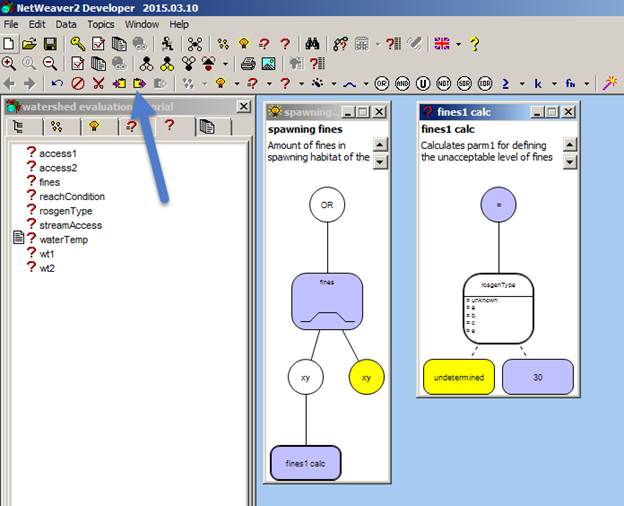
To begin, click on the left hand xy-pair so it is selected, then click on the calculated data link button on the button bar as indicated in the next figure.
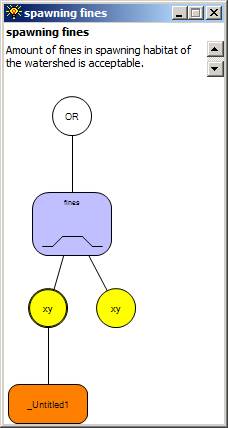
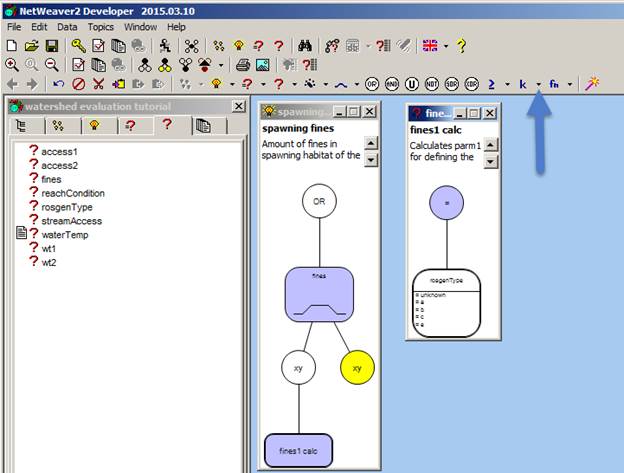
The calculated data link list box is displayed on the right side of the NetWeaver window. Click on the New item to create a new calculated data link. The network for spawning fines now looks like the following.
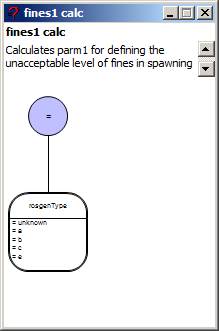
Double click on the new calculated data link. Note that a new empty 'network-like' window is created. Now, though, instead of an OR as an anchor, there is an orange equal sign. This is your visual clue that this is a different type of network. This is the network window for defining a calculated data link.
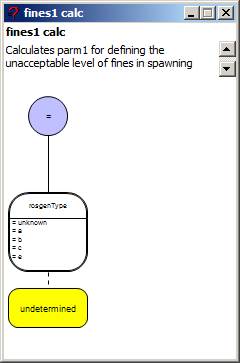
Click on the name, _Untitled and replace it with 'fines1 calc.' You can name calculated data links however you want, but it is a useful practice to append 'calc' on the end of the name so that calculated data links are easy to spot in network diagrams. For the hint, enter something like 'Calculates parm1 for defining the unacceptable level of fines in spawning beds.'
Now we are going to add a logic switch to fines1 calc. In this example, we are using the switch as a lookup table. The switch will read a simple data link named rosgenType, and assign an x-value based on the choice of Rosgen type. Rosgen types describe stream morphology and are coded as a, b, c, etc.
To create the switch, click on the switch button as indicated below.
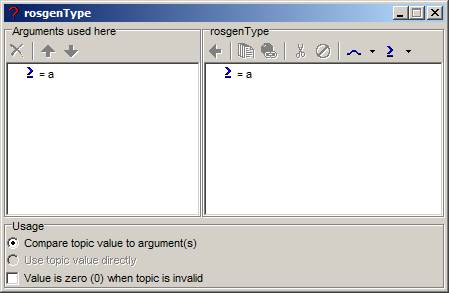
A list box for switches is displayed on the right side of the window. The blue arrow points to an icon that indicates we are creating a switch. The right arrow points to an icon that indicates we will use a simple data link in the switch. If the icon under the red arrow is =? Instead of ?, click on the black arrow next to =?, and change the icon to ?.
With the type of data link now set to a simple data link, click on the New item to create a new simple data link that will be used by the switch. A data link property pop up comes up. Name the data link 'rosgenType,' and for the hint enter 'Select the appropriate Rosgen class for this watershed.'
When you close the data link property window, a new data link argument window is displayed in which we will specify the various choices for Rosgen classes.
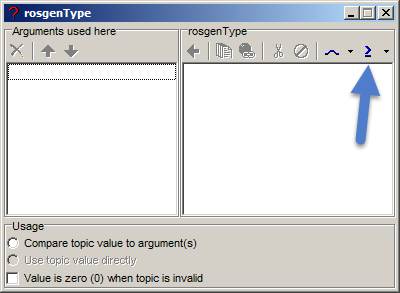
The arrow in the above figure points to an icon for defining Boolean comparisons. Click on the arrow to define the first choice. A new dialog opens to define the Boolean comparison.
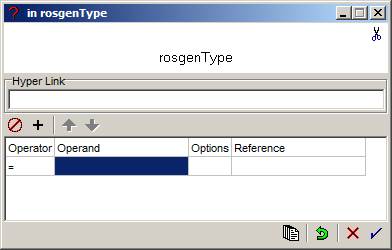
The operator field is set to =, which is the default. This is what we want, so leave the operator set to =. Next, click in the operand field, and enter 'a' without the quotes, then click the checkmark in the lower right corner to finish. The previous window has been updated, and looks like the following.
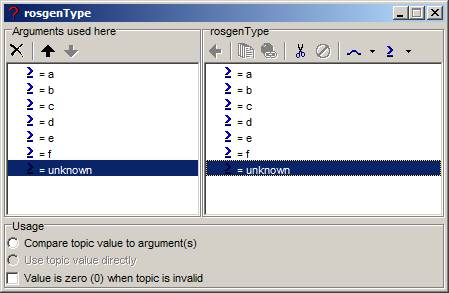
Click the Boolean comparator four more times. Each time, leave the operator set to =, and add the following choices:
b, c, d, e, f, and 'unknown.'
When you are done, the argument window should look like the following.
The full range of choices for Rosgen type is a to f, but for the Chewaucan example assessment, we actually do not need the d and f choices, so we want to remove these from the list of arguments used in the switch. In the list on the left, click on d and click X to delete it. Do the same for f. We also want =unknown to be the first choice. Click on unknown, press the up arrow to shift it up in the list, and repeat until unknown is listed first. When you are done, the argument window should now look like the following.
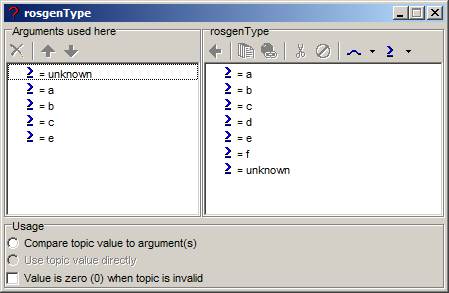
Notice that, when we deleted the d and f choices on the left, they are still available in the right hand list. We just are not using them in the Chewaucan example, but we may as well leave them in the knowledge base because they might be needed in a different geographic setting.
Now close the argument dialog window. Back in the main NetWeaver window, notice the update to the calculated data link for fines1 calc.
rosgenType appears at the top of the switch to indicate that this is the data link read by the switch. The lower portion of the switch displays the choices that are available. If there are more than 5 arguments assigned to a switch, only the first five will be visible in the switch object. However, you can view the full list by right clicking on the switch, and pointing to Arguments in the context menu that pops up.
We will complete the specification of the switch by mapping Rosgen choices to corresponding values for fines1 calc. The mapping that we want is as follows:
Rosgen |
fines1
calc result |
Unknown |
Undetermined |
a |
30 |
b |
30 |
c |
30 |
e |
30 |
To finish the mapping, first make sure that the switch is selected in the calculated data link window. Now click on the arrow to the right of the k in the button bar, and choose 'undetermined.'
The switch now looks like the following.
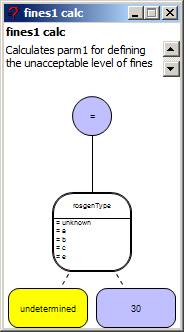
Now click on the k button directly. By default, it creates a constant named k.
Click on the k to select it, and replace it with the value 30, and then close the constant dialog.
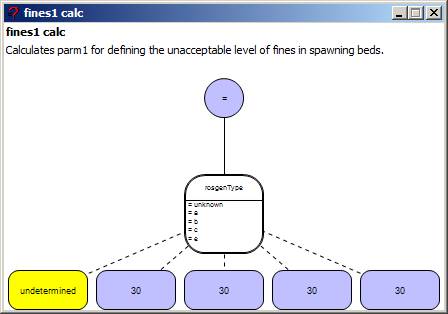
Now we have the following.
We want to add three more copies of 30 (we explain why shortly). An efficient way to add the extra copies is to highlight the above 30 in the window, and then click on the copy button on the button bar as indicated.
Now reselect the switch node, and press the paste button three times.
The completed switch looks like the following.
Here is how the switch functions as a lookup table:
1. When fines1 calc is evaluated in NetWeaver, the switch reads the value of rosgenType.
2. If the value of rosgenType is 'unknown,' then the switch evaluates to undetermined (see below), so fines1 calc is also undetermined.
3. If the value of rosgenType is a, b, c, or e, then fines1 calc gets assigned a value of 30 for use in the fuzzy node.
Undetermined is a special state that tells NetWeaver that we do not have a value for rosgenType, so a value for fines1 calc cannot be assigned. In essence, it is unknown. It is actually not necessary to explicitly assign undetermined in EMDS because, if the field for rosgenType is blank for any record in the geodatabase, it will cause fines1 calc to be undetermined. However, when running NetWeaver interactively (a subject of the second NetWeaver tutorial), it is actually useful to explicitly model the case of missing data as in the specification for fines1 calc as shown in the last figure above.
You might find it a bit odd that we went to all this trouble to assign fines1 calc a value of 30, regardless of the rosgenType. The reason is simple. In designing this portion of the knowledge base, the assignments to fines1 calc based on rosgenType did not start out this way.
Now we need to get back to completing spawning fines. Here's where we have gotten to.
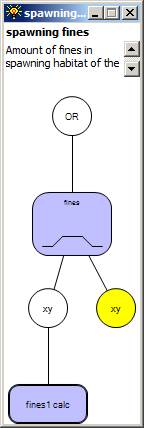
To finish the left hand xy-pair, select the xy-node, click on the k button, and rename k to -1, as we done a few times now.
Now we have the following.
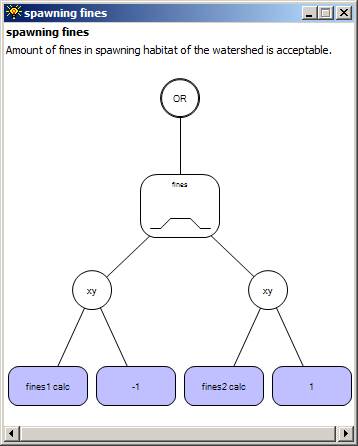
Review what we have done so far in creating the spawning fines topic, and create 'fines2 calc' as the x-value on the right hand xy-node, and finish up by adding the constant 1 to the node as well. When you are done, spawning fines will look like the following.
And the specification of fines2 calc should look like the following.
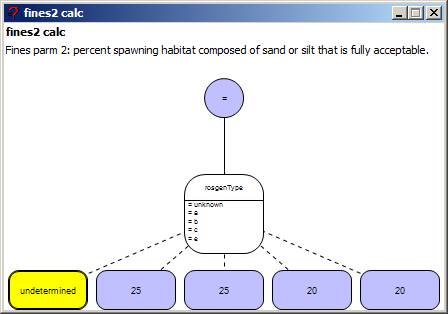
Notice, now, that the assignment to fines2 calc does vary with rosenType.
Rosgen |
fines2
calc result |
Unknown |
Undetermined |
a |
25 |
b |
25 |
c |
20 |
e |
20 |
This completes the specification for spawning fines, so close the network window for spawning fines.
Complete the logic specification for 'upland condition'
At this point in the tutorial, we have now demonstrated all the steps for creating goal groups, goals, data links, fuzzy nodes, etc., that are pertinent to creating the chewWS knowledge base. Rather than plod along, creating all the goals and data links, etc., for this new topic, we will take a shortcut, and demonstrate copying and pasting knowledge base components between two knowledge bases.
Click on File and then Open, and, if necessary, navigate to the folder C:\Program files (x86)\EMDS 5\sample data\.
Select the file named chewWS.nw2. This is the completed version of the knowledge base that you have been building.
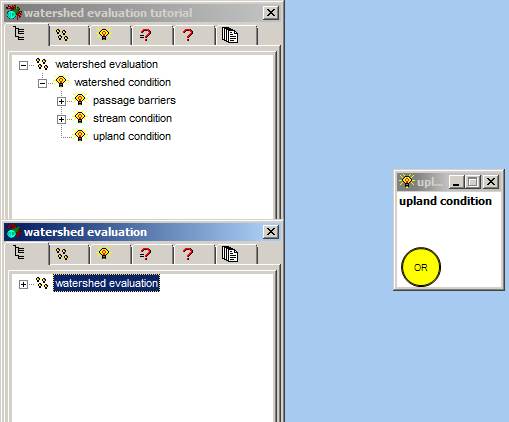
Notice that now there are two project windows open in the NetWeaver interface. You can keep them straight based on the somewhat different descriptions that are displayed at the top of the project window ('watershed evaluation' versus watershed evaluation tutorial').
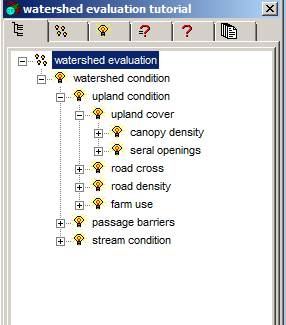
In your tutorial version, expand the logic outline in the outline tab so it looks like the following.
Double click on upland condition to open its network.
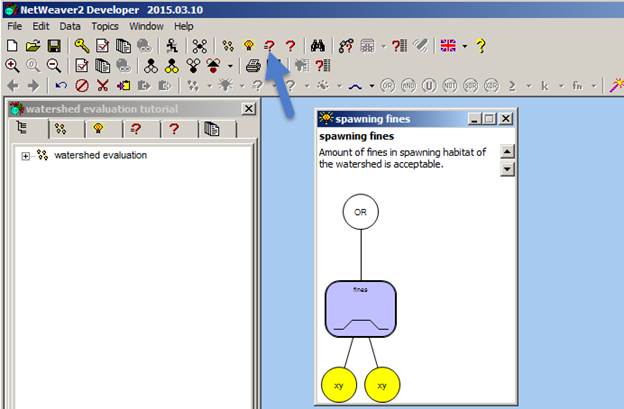
Now click on the project window for the completed version to raise it to the top.
Expand the logic outline for the completed version, and then double click on upland condition to open its network window.
In the network for the completed upland condition, click on the U node to select it, and then click the copy button on the button bar as indicated below
 .
.
Now click on the OR node in the empty network for upland condition in your tutorial version to make that network dialog the active one, and then click on the paste button as indicated below.
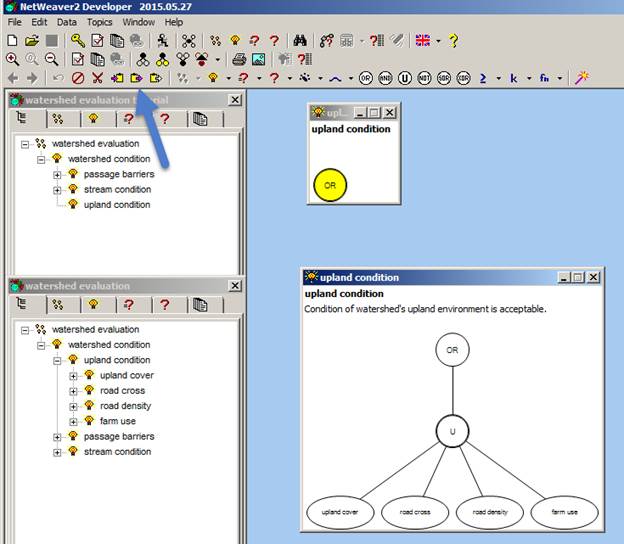
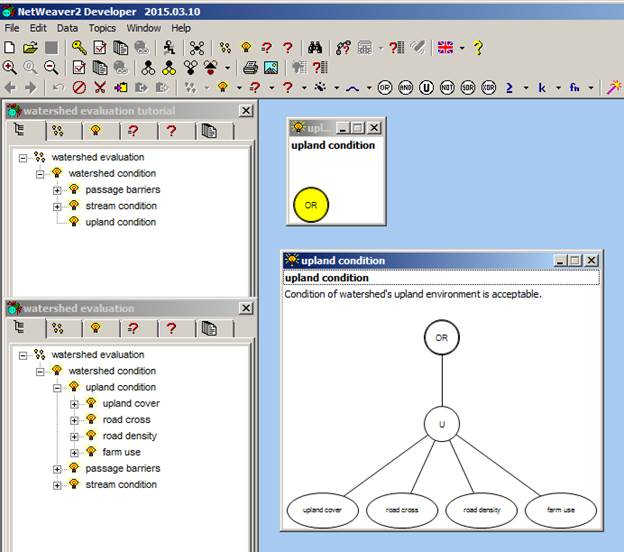
After you click paste, you will have two identical versions of upland condition as in the following figure.
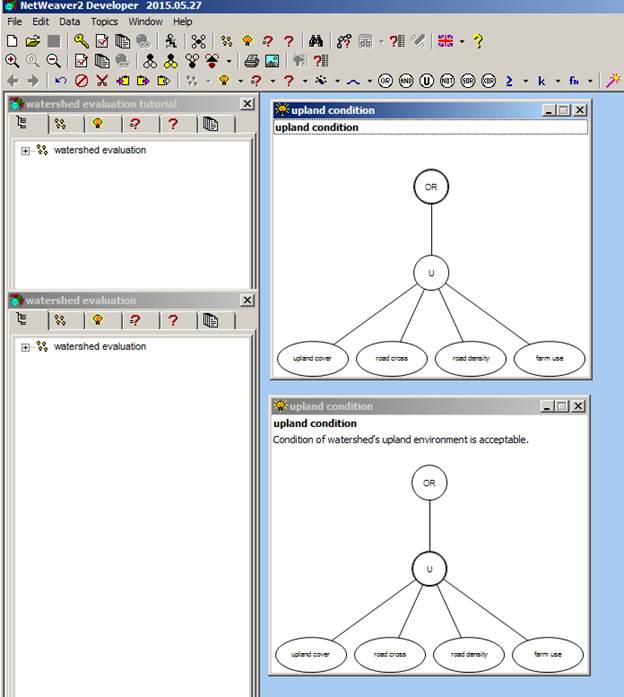
Now click File and then Save to save your updated version of the tutorial version. We are done with copying from the full version of the knowledge base, so, to clean up a bit, close the project window for the full version by clicking on the X in its upper right corner.
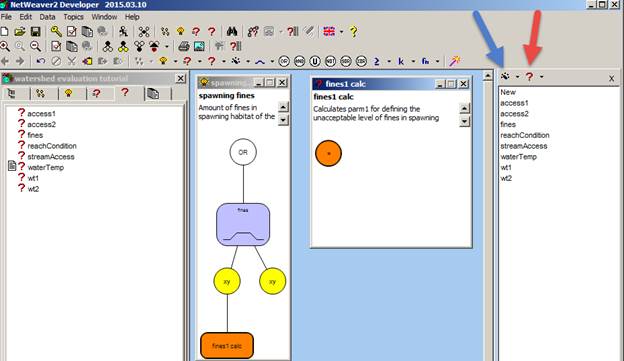
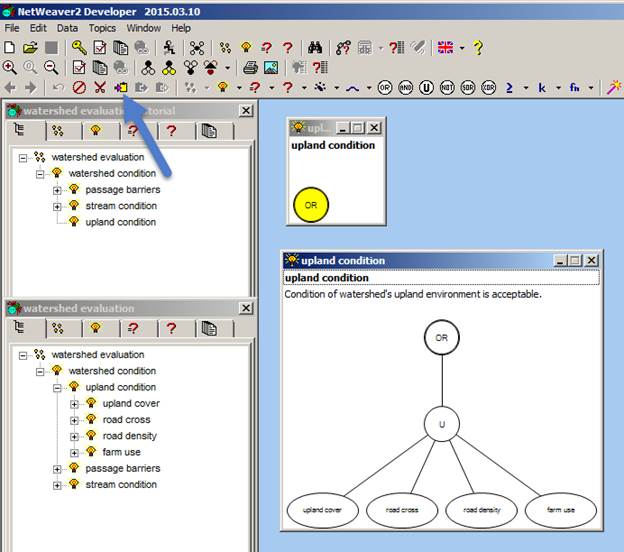
Let's take a look, and see what we actually copied. In the outline tab, expand the logic outline as in the figure below.
Keep clicking on the plus signs for all the goals under upland condition, and you will see that we actually copied a great deal of logic structure! In addition, all the documentation associated with upload condition and its children that had been created in the full version has been carried into the tutorial version as well. As you can see, copying and pasting between knowledge bases is fairly easy, and can be a huge time saver when you want to share portions of logic across multiple knowledge bases.
Reviewing the logic of the knowledge base
With the addition of the logic for upland condition, the logic specification for our watershed evaluation is now complete. Now would be a good time to review the full structure. You can see the overall structure in the outline tab by expanding topics as we have been doing. To get an idea of how the outline represents logic structure, let's expand stream condition, and then double click on stream condition in the outline.
As you can see, the outline always displays the immediate logical antecedents of the parent goal. In this case, reachCondition (a data link), spawning fines, and water temperature are the next level below stream condition in the outline, and this corresponds to the logic structure that you see in the stream condition network. As another example, expand spawning fines in the outline, and then open the network for spawning fines.
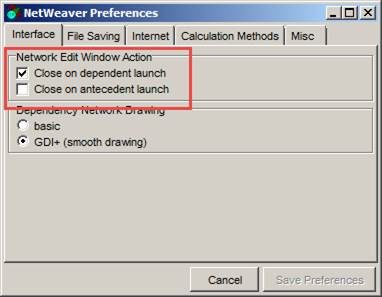
Close any open network windows, and then open the network for watershed condition. In the network window, double click on upland condition, and its network opens. Thus, you can navigate from one network to any of its children to as many levels as you want. By default, whenever you open a child network, the parent remains open as well. You can change this behavior under Edit ' Preferences from the Interface tab.
So far, we have been navigating from one network to another. For a full graphic overview of the logic, click on the dependency overview button on the button bar as indicated below.
Below, is a partial view of the logic for watershed evaluation.
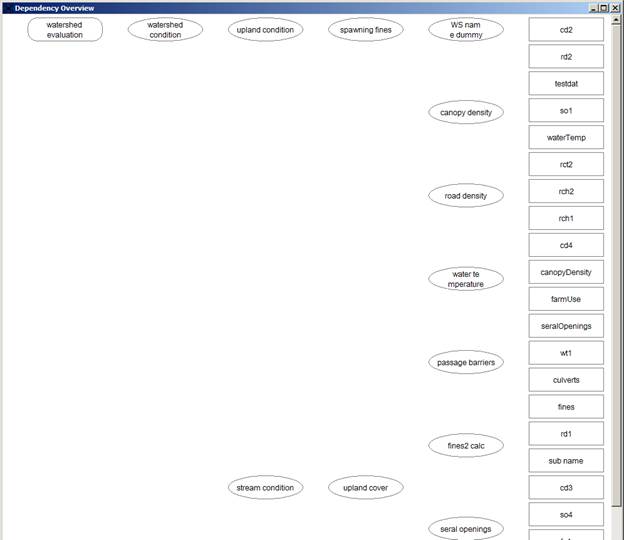
To visualize the logic connections from any node, click on that node. In the example below, watershed condition was selected.
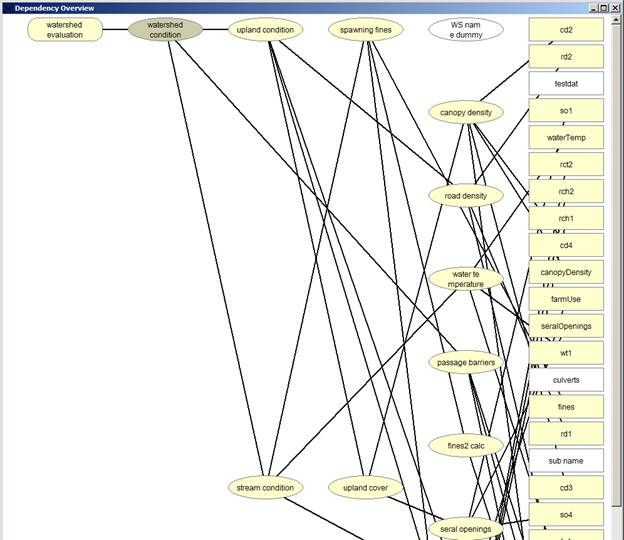
For a complete view of the logic, right click in the viewer, and choose zoom out.
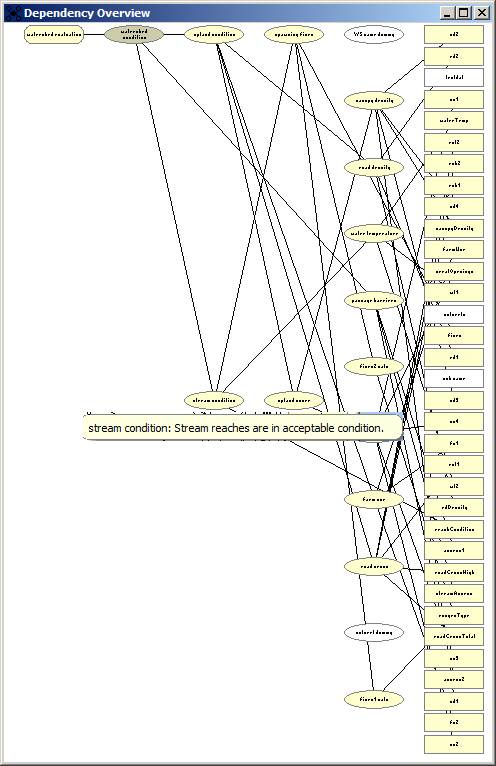
Although the text in the viewer becomes unreadable at this zoom level, notice that you can hover over a node to view it's name, and, in this example, the proposition that is being tested by the stream condition network.
A forthcoming NetWeaver tutorial
Watch for a forthcoming tutorial that covers a variety of additional knowledge base development topics. Some of the topics will include
' Concepts and principles behind logic operators such as NOT, AND, OR, Union, and SOR.
' Running NetWeaver interactively, for example, to test and verify network behavior.
' Integrating extensive and detailed documentation on logic topics in rich text format (RTF), including external hyperlinks.
' Creating comprehensive knowledge base documentation in HTML.