
Beginning Development of EMDS for QGIS
EMDS Visual Overview
Before we begin the tutorial, a review of the interface of EMDS 8.5 within ArcMap needs to be done. Below is a sample of the UI, along with the important information about each item.


Tutorial Introduction
Given the varied applications of EMDS, the case study in this tutorial was selected because it shows off all the major components within EMDS. By going through this tutorial, you will, by the end, understand the various parts of the EMDS Framework and their supporting tools. The tutorial uses EMDS to evaluate and prioritize restoration opportunities in the Chewaucan Basin in the Fremont-Winema National Forests of south-central Oregon
The tutorial is broken into the following steps:
1. Starting EMDS
2. Establishing Linkage Between Scales of Assessments
3. Create New EMDS Project
a. (OPTIONAL) Change Layer Symbology
4. Create an Assessment
5. Create a Classic EMDS Analysis (OPTIONAL)
a. Creating the Knowledgebase
b. Loading a Knowledgebase
6. View Results of Classic EMDS Analysis
a. Display On Map
b. Display On Grid
c. Hotlink Manager
7. Scenario Manager
a. Create New NetWeaver Scenario
8. Prioritizations
a. Create New Prioritization
b. View Results
c. Prioritization Manager
Tutorial Goal
The problem which we will be tackling in this tutorial will be to evaluate the current conditions of the Chewaucan River Watershed by examining the terrain conditions, stream conditions, and passage conditions. Since the early 19th century, natural ecosystem dynamics in the Chewaucan basin have been disrupted by anthropogenic pressures, resulting in habitat degradation and reduced water quality, threatening biodiversity and the livelihood of local communities. With the decimation of beaver populations, key ecosystem engineers, by trappers in the early 19th century, stream processes changed. No longer regulated by beaver dams, stream energy increased, resulting in greater rates of bank erosion and downcutting. By the late 19th century, intensive grazing and logging further accelerated erosion rates and impacted watersheds (Peets, S. & Freidrichsen, T. 1999).
Concerns about water quality and the falling numbers of native salmon and redband trout in Upper Chewaucan Watershed prompted action from the Forest Service, Bureau of Land Management (BLM), and other stakeholders. Water temperatures in the watershed had exceeded the limits specified in the Clean Water Act and redband trout were under consideration for listing under the Endangered Species Act (Peets, S. & Freidrichsen, T. 1999). With their habitat fragmented by dams and populations threatened by introduced non-natives, many species of redband trout have subsequently been listed as Species of Concern (Forest Service 2011, US Fish & Wildlife Service 2011). Under the Northwest Forest Plan, the inter-agency Forest Ecosystem Management Assessment Team (FEMAT) was established to protect and restore fresh-water fish habitats throughout the region. Under this initiative, the Ecosystem Management Decision Support system (EMDS) was used by the Forest Service to evaluate the condition of the Upper Chewaucan Watershed at multiple scales and prioritize its restoration (Reynolds, K. & Peets, S. 2001).
Step 1 - Starting EMDS
If this is the first time you are opening EMDS after installation, you will need to click on the Display EMDS Panel button, as shown below:
![]()
After you click this button, you will see the following docked window:
Step 2 - Creating a New Project
This tutorial evaluates the condition of the subwatersheds that make up the Chewaucan basin.
As a prelude to the tutorial on watershed-scale assessment, first consider how two scales of assessment may be linked with each other in some manner. Recall that a knowledge base is a formal specification for interpreting data. For NetWeaver knowledge bases in particular, each knowledge base is designed as networks of topics. Each knowledge base is relatively scale-specific because the nature of the questions to be posed (or topics to be evaluated) and the way in which they are answered tends to change with scale.
In the context of the Chewaucan assessment, two scales are of interest: the reach and subwatershed scales, and the project contains a knowledge base for each scale. In EMDS, the concept of knowledge bases as networks of topics is extendable to assessments. That is, we can think of assessments as providing formal specifications for the evaluation of networks of knowledge bases when the basic assessment problem suggests the need for multiple scales of evaluation. This is a very simple, but powerful, idea. While the Chewaucan example is limited to two linked scales of evaluation, the idea is easily extended to multiple scales, and there is no requirement that scales be hierarchically nested. Thus, we can think of networks of knowledge bases as opposed to hierarchies of knowledge bases.
So, how could specifications be developed for linking scales? The basic approach requires summarizing information from one scale in a manner that makes the information applicable at another scale. In general, some sort of transformation of information is needed when moving information from one scale of evaluation to the next. In the Chewaucan assessment, for example, evaluations of reach condition are summarized by subwatershed as the length-weighted average of reach condition results, and the length-weighted average results are provided to the attribute table of the subwatershed layer.
Step 3 - Create New EMDS Project
The Chewaucan tutorial includes data and knowledge bases for evaluating both reach and subwatershed features. Both scales of assessment can be included in a single EMDS project. At times, it may be more convenient to build separate EMDS projects for separate scales of evaluation. For example, with separate projects, two subteams can work more or less independently of one another. In general, however, it is more advantageous to perform evaluations of all scales within a single project because, for example, results from multiple scales can be displayed together in layout views or superimposed on one another in the map view.
The EMDS project contains the hierarchy of assessments, analyses, data layer references, and scenarios necessary for an ecosystem assessment. Once a project is created, notes and comments can be added to an EMDS project using its Description items. EMDS assessments are created at the project level.
The data and pre-built models for this tutorial can be downloaded at https://emds.mountain-viewgroup.com/downloads/chewdata.zip. - Unzip it to a directory that you can easily find again.
Tutorial Task - Add Data
For the first step, we need to add data to a blank ArcGIS map document. If you already have a map document open, you will need to create a new map document by going to the FILE -> NEW menu choice.

Click the Add Data button as you see indicated above. You will need to browse to where you unzipped the sample project. - Select the chewaucan.gdb folder. Select the feature classes listed below and click Add.
After you press Add, you will get a warning dialog below. It is safe to ignore it, so you can press OK.
Save the map document as Chewaucan.mxd.
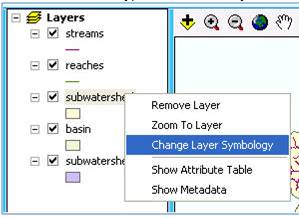
OPTIONAL Tutorial Task - Change Layer Symbology
1. In the TOC, right click the name of the layer that you would like to change inside the Layers area.
2. Select Change Layer Symbology from the drop down box.
3. Choose what color and line type or outline width you would like and click OK to register changes.
Tutorial Task - Create New Project
Click on the New Project button in the EMDS Project Pane.
When you click this, the Create Project Wizard will appear.
Within the Create Project Wizard, specify the project name as Chewaucan1, and make sure all the layers are selected. For the description, enter the following - This is the first sample project - . The description you enter here belong to the project - s comments. Comments can later be modified or added to by going to the OTHER ACTIONS button on the EMDS Project Pane and selecting Comments. By pressing the Launch Comment Editor, you will be given a complete editing environment to add additional elements such as tables or pictures.
Your screen should look like the one below. - Press OK to create the new project.
Step 4 - Create an Assessment
Once you have created an EMDS project, the system will automatically initiate the steps to create the first assessment. The Create Assessment Wizard will guide you to select data from the current map document (see add GIS layers) to be associated with the assessment, and also to create a study area which defines the spatial extent of the assessment, with polygon features from the associated layers. You may create more than one assessment in an EMDS project, and add comments for each assessment. If you wish to create more assessments, right click on the project details pane and select Create New Assessment, or press the Create New Assessment Button in the toolbar.
![]()
Figure 1- Create New Assessmssment By Toolbar
Figure 2- Create New Assessment by Right-Click Context Menu
Tutorial Tasks - New Assessment
In the Welcome Screen, enter in the following information and click Next.
![]()
The next page displays the possible layers to include in the assessment. You will set the suberwatershed layer as - include layer as target - in the dropdown box, and for the basin layer you will select - include layer in assessment - .
The possible choices are shown below. Include layer in assessment means the layer will be included in the final assessment dataset. Include layer as target means the layer will be the target of the spatial selection done on the next wizard page. Include layer as selector and include layer as selector with data allow the user to specify a layer to be the - template - layer which will limit the spatial extent of the target. Include layer as spatial map layer will include the layer along with the generated overlay layer, but this layer does not participate in the overlay. In other words, it is only included in the assessment as a separate spatial layer for reference.
Click Next to continue to the next step in the wizard page.

On this page, you can select one or more features in the selected target layer. Step 1 is to click on the Select All icon as shown above, and then for Step 2, click on Next to continue to the next screen.
On this screen, you can verify that the generated Overlay layer is correct. Click Next to Continue, and then click Finish to complete the wizard.
Your screen should now look like the figure below.
Step 5 - Create - New Analysis Task Path with a Classic EMDS Analysis
Within an EMDS assessment, you may create one or more EMDS analyses. There are two types of analysis, a Classic EMDS Analysis, which leverages a NetWeaver knowledge base as the basis of the analysis, and a Prioritization Analysis, which leverages CDP models as the basis of analysis.
In this tutorial, we will be starting a Classic EMDS Analysis. When creating an analysis, you will load an existing NetWeaver knowledge base, select knowledge base topics for evaluation, run or evaluate the analysis, display the results, and create one or more scenarios. A NetWeaver knowledge base is loaded at the analysis level for knowledge base topics to be selected/evaluated and results propagated to scenarios. Each analysis may only have one knowledge base but may have multiple scenarios. You may also add comments to an analysis and edit these comments at any time.
Tutorial Task - Create Analysis Task Path
The new task pane will appear. - - We will select NetWeaver under the Analysis Engines, and press OK.
The New Classic EMDS Analysis Wizard will display. - Name the analysis - WatershedAnalysis. -
Click on the Next button to continue. The next screen will ask you to select a NetWeaver model file.
Click the Browse button, and select the chewWS.nw2 file located in the models folder from your download sample zip file.
Click Next to continue.
![]()
![]()
![]()
We wish to add the watershed evaluation as part of the analysis. [UFS1] Step 1 is to click on this topic in the tree with the available topics. Step 2 is to click Add to move those topics to Selected Topics. Step 3 is how your current wizard screen should appear. Click Next to continue.
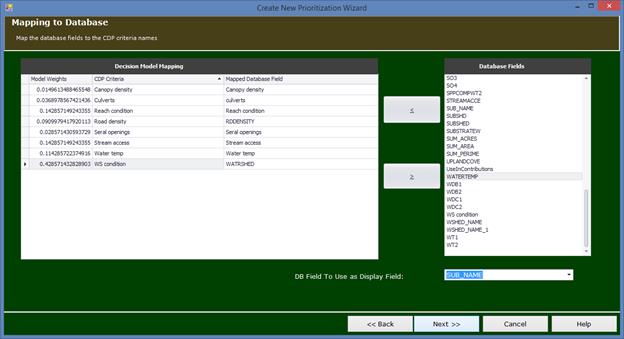
Sometimes the Knowledgebase Name in the left panel is empty because EMDS was unable to automatically map between the Database Field Name and the Knowledgebase Name. Thus, you should scroll through the KnowledgebaseName list on the left panel (Mapped Fields), and find the associated database field name in the Available Database Columns from the right panel. For example, we want SUB_NAME in the Available Database Columns to be matched to subname in the KnowledgebaseName list.
You will select an unmatched KnowledgebaseName from the left panel, find and select the associated database field name from the Available Database Columns in the right panel and click the less than sign (<) to push the name into the Mapped Fields list. Conversely, the greater than sign (>) can be used to remove incorrectly matched database field names from the Mapped Fields list, and put them back onto the list of Available Database Columns.
Click on the - Next Button - , and then click - Finished - . Your project detail view should appear like below.
Step 6 - View Analysis Results
There are three ways to view the results of any task, including the initial analysis:
- Hotlink Manager
- View the results in a table
-
View results in chart
To view the results of any analysis or tasks, you should right click on the task, and you will see the following menu:
Tutorial Task - View Hotlink Manager
EMDS has the capability of displaying sophisticated spatial information. The spatial data produced by an analysis or scenario take the form of map layers. The EMDS map layers are produced by performing a "table join" between the analysis overlay and the appropriate results table produced by the outputs of the NetWeaver Engine. - - The hotlink viewer will show the following screen at startup.
The first step is to select the topics, so we will click the topics to view:
We will select - watershed condition - , - canopy density - , and - road density - from the list.
The system will then load these items as shown:
Now, you can see how a specific feature is displayed by clicking on the Identify button (first icon in map toolbar). - - Click on the red feature in the upper right hand side of the map, and you will see:
To see a grid version of this, you can click on the view results in table view in the button at the top of the screen.
To add these layers to the map, click on the - Add Selected Topics to Main Map and Close - . - Your map TOC should now look like this:
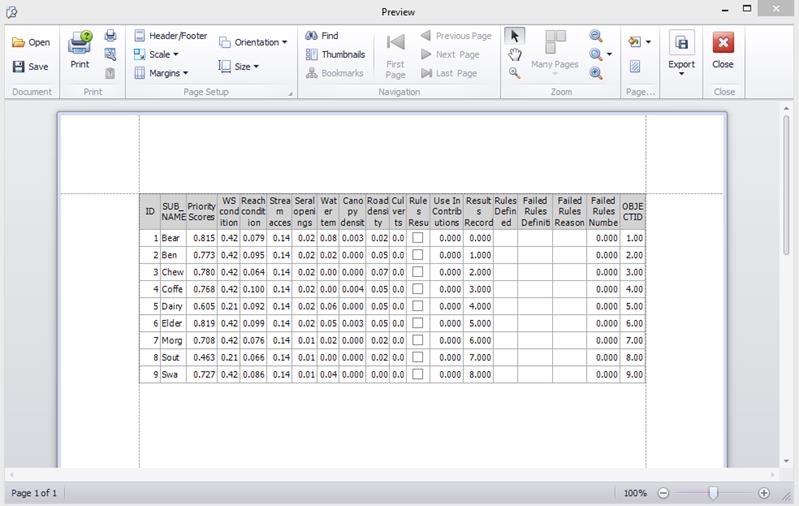
Tutorial Task - View Topic in Grid
Click on Display in Grid to bring up a display similar to this:
In addition to being able to
group, filter, and reorder columns, the user can export the table to an Excel xls file format or print the table. If selecting
print table, you will be given a print preview of the table to be printed, as
well as options on changing the layout, margins, and paper types. - You can also build a custom graph or report based
upon the current selection on the grid.
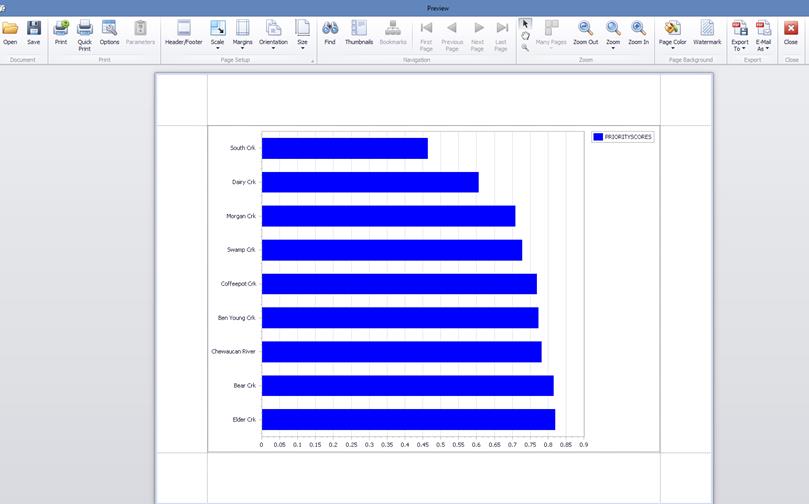
Tutorial Task - View Topic in Chart
Clicking on the Display in Chart will cause a new screen to appear along with a Chart Designer view.
Click on the (+) sign next the term - Series - , and select Bar from the menu choices. - Go to the Data Tab, and select for the argument as - sub_name - , and the value as - nw0__road_density - .
Click OK and you will see the following:
You can click on the - Run Chart Wizard - to modify the chart, or you can print or export the chart.
Step 7 - Prioritizations
The results of the analysis alone - an objective assessment of the condition of watershed - are not enough information to effectively prioritize restoration efforts. If restoration efforts targeted the most degraded subwatersheds, streams, and up-lands in the Chewaucan Basin, a lot of time, effort, and money might be spent with little effect. The ecosystem in the worst condition might not be the best candidate for management or restoration. To be effective, restoration must be feasible.
The overall priority score for each landscape element (a spatial alternative) is calculated as a sum of products: the utility score for the observed attribute value times the weight of the associated lowest level criterion, summed over all attributes. Each utility score has a value ranging from 0 to 1, and the sum of weights for lowest level criterion is 1, so an ideal alternative (e.g., one that scored perfectly on all lowest level criteria) would get a priority score of 1. Conversely, an alternative that did not meet any of the minimum requirements for utility would receive a score of zero. -
For Prioritizations, the workflow through the system is as follows:
1. Priority Analyst Engine and Prioritization Manager uses multi-criteria decision analysis to prioritize restoration efforts and management actions.
2. Load a multi-criteria decision analysis model. A database for the Priority Analyst will be generated automatically. Input: CDP knowledgebase.
3. Link the fields in the PA database with the fields in the CDP knowledgebase.
4. The Priority Analyst will use MCDA to calculate priorities for the database linked to the CDP knowledgebase.
5. Use the Priority Analyst to study the prioritization results. Output: Print or export Excel spreadsheets with the prioritization results.
Display the prioritization results in ArcMap. Output: Priority maps.
Tutorial Task 1 - Create Prioritization
On the EMDS Classic Analysis bar, select the - Other Actions - button, and select - Create Prioritization - .
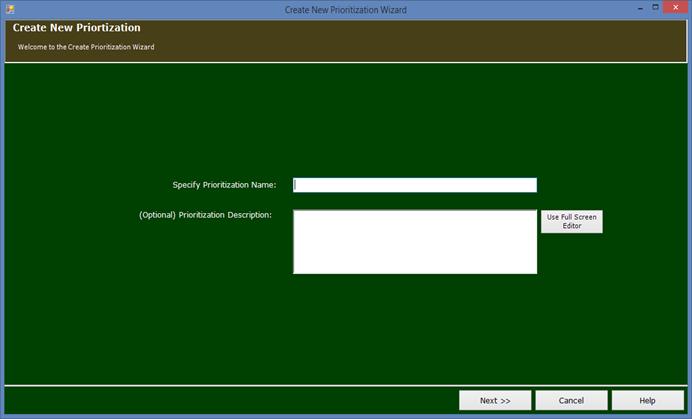
The name of the prioritization is Watershed Prior 1. Click next to continue
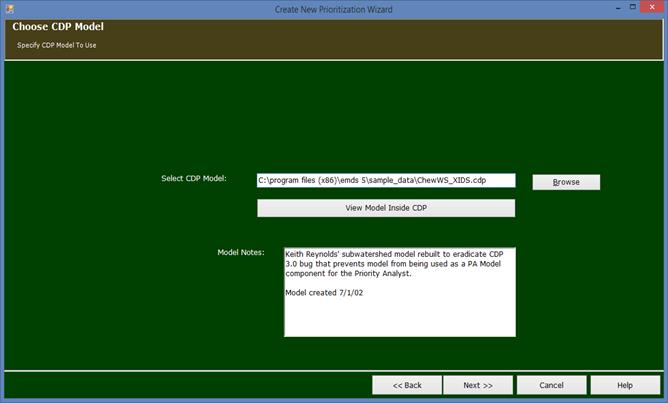
On this screen you select the prioritization/CDP model to include in the project. Click next to continue.
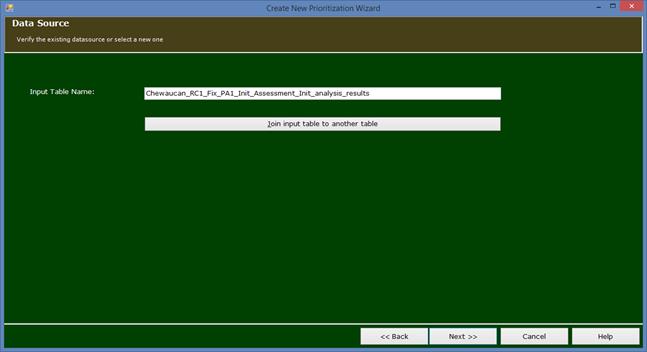
On the above screen, the table name is automatically inserted based upon where you started the prioritization. In this case, since this was a prioritization based upon the analysis, the table name is the results table name. Click next to continue.
On the next screen, you need to map the database fields to the CDP model names. In this case, since the XID field was filled out in CDP, the auto-mapping happened automatically.
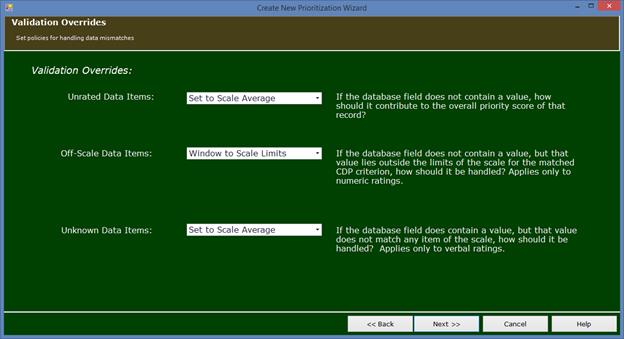
Click next to continue. You can override the default settings on this screen. Click next to continue.

Click Next to Continue.
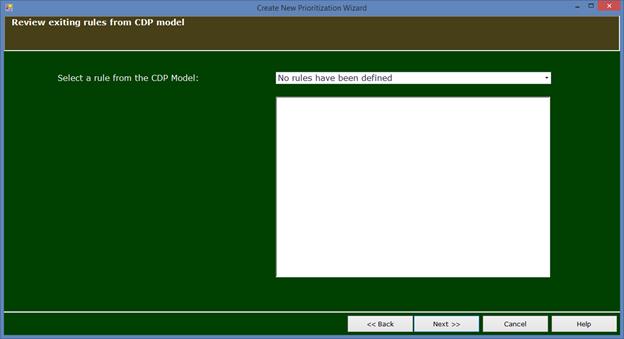
Click next to Continue and Finish on the next screen.
Congratulations, you have your first Prioritization built.
Tutorial Task - Viewing Results
The next step is to view the Prioritization results. Right-Click on the CDP task and select view Hotlink.
The Display Prioritization
screen is the displayed. It has the ability to
print the current table or chart on the individual tabs
or
, and give the user the option to display this prioritization on the main project map. The tabbed display appears broken down into the following:
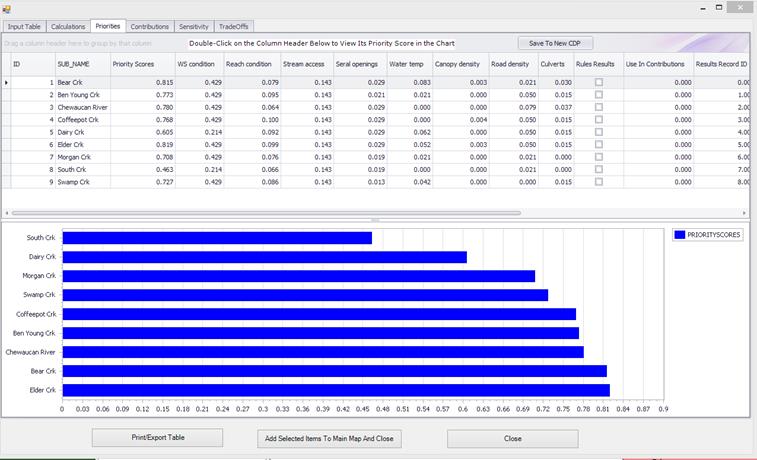
- Input Table - The data that was used to calculate the prioritization
- Calculations - The results and statistics associated with the calculation
- Priorities - Displays the priorities scores for each feature. By default, the contributions tab shows how the overall priority score is composed of the contributions from the primary criteria, which are at the first level of the criteria hierarchy below the highest level (e.g., the goal). Note that list boxes below the graph allow how to set the target level to any criterion below the goal. For example, you could set the target to the efficacy criterion in our example, and then set the source level to level 3 to see how subcriteria under efficacy contribute to the overall score for efficacy. In general, to see the contributions from lower levels of the CDP model, select a criterion from level n as the target, and set the source level to level n+1. -
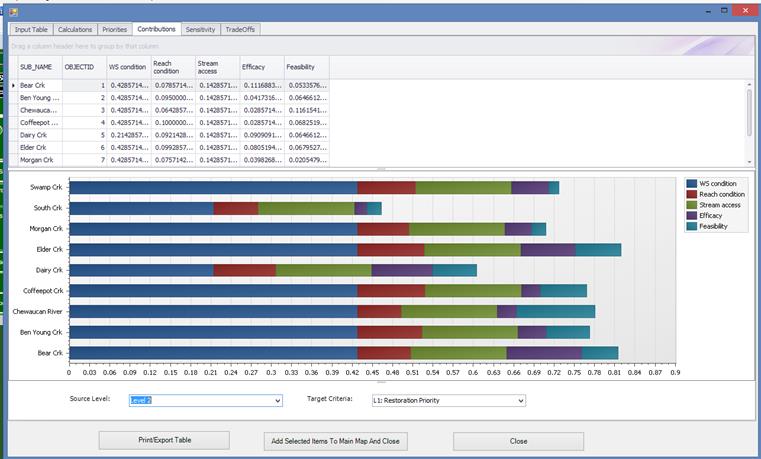
- Contributions - Allows the user to see how a level of the model affects specific targeted criteria. Please note that the source level should always be at a lower level the target criteria.
By default, the
contributions tab shows how the overall priority score is composed of the
contributions from the primary criteria, which are at the first level of the
criteria hierarchy below the highest level (e.g., the goal). Note that list
boxes below the graph allow how to set the target level to any criterion below
the goal. For example, you could set the target to the efficacy criterion in
our example, and then set the source level to level 3 to see how subcriteria under efficacy contribute to the overall score
for efficacy. In general, to see the contributions from lower levels of the CDP
model, select a criterion from level n as the target, and set the source level
to level n+1
-
Sensitivity - Allows the user to see the sensitivity of a criterion to a
sub-criterion.
The sensitivity tab shows how sensitive the CDP model is to changes in
criterion weights. Note that sensitivity in this version of the Priority
Analyst assesses sensitivity as the absolute percent change in a criterion
weight needed to replace the top ranked alternative (e.g., a landscape feature
such as a watershed) by some other alternative. In this example, Elder Creek
has the highest priority score, and thus is the top ranked alternative.
However, if the weight on efficacy was 2 percent higher, Elder Creek would be
replaced by Bear Creek (the usurper) as the top ranked alternative. Entrees in
the table are listed from most sensitive to least sensitive. As a good general
rule, you can consider a CDP relatively robust to changes in criteria weights
if the most sensitive criterion would require at least a 10 percent absolute
change in its weight before the top ranked alternative is replaced by another
alternative. So, in this example, the model is really more
sensitive than we would like to see ideally.
Sensitivity results are determined both by the data values associated with
alternatives and by the weights assigned to the criteria. Consequently, you can
very different sensitivity results in scenarios when you alter data values or the
logic structure of the NetWeaver model. In the Chewaucan
case, for example, a scenario in which road crossings and farm use are ignored
in the NetWeaver model (recall our earlier example of ignoring these topics)
would result in a rather different set of sensitivity results. You might want
to try this out for yourself.
-
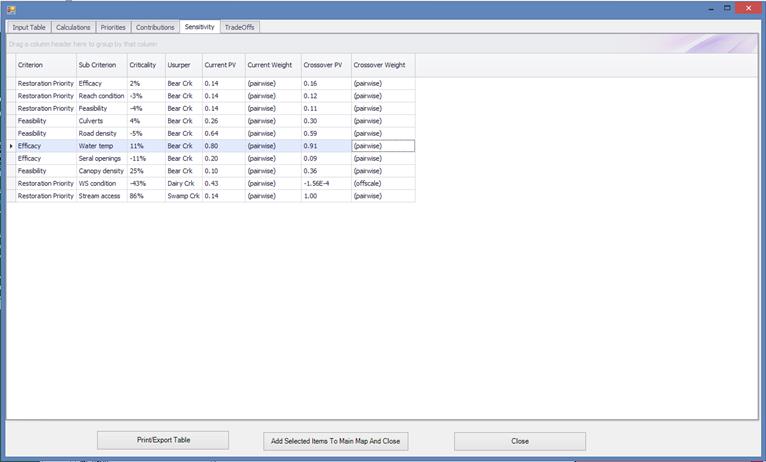
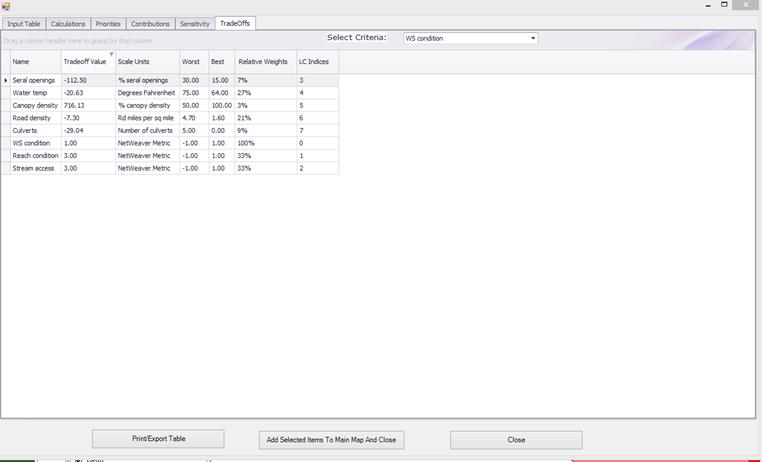
- TradeOffs - Displays the tradeoffs of the various data with regards to specific Prioritization Criteria
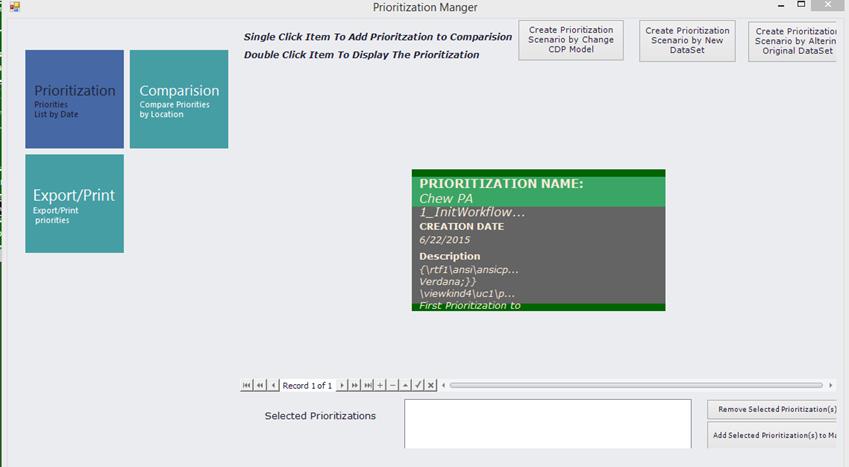
Prioritization Manager
Prioritization Manager is made to allow you to view the current prioritization and to compare it against existing or new prioritizations. The idea is to allow the user to have an environment where they can view multiple prioritizations, compare them, and be able to export the CDP model or data.
Tutorial Complete
You have now completed this tutorial and you should be able to evaluate the condition of the subwatersheds that make up the Chewaucan basin. If you have any questions, please email: supportmountain-viewgroup.com.
[UFS1]The user should select watershed evaluation. This is the full model. The components are just separate pieces.