
Explore Chewaucan, from condition to priorities
Follow the example from the introductory videos. Work with nine subwatersheds, inspect a NetWeaver condition assessment, and see how CDP turns the evidence into management priorities.
A workspace you can explore and rebuild
Start with the prepared workspace to inspect the full assessment chain, or use the starter data and models to create the analysis yourself.
Prepared workspace
A portable .emdsworkspace package brings the QGIS project, study data, models, configured tasks, and results together.
Sample data and models
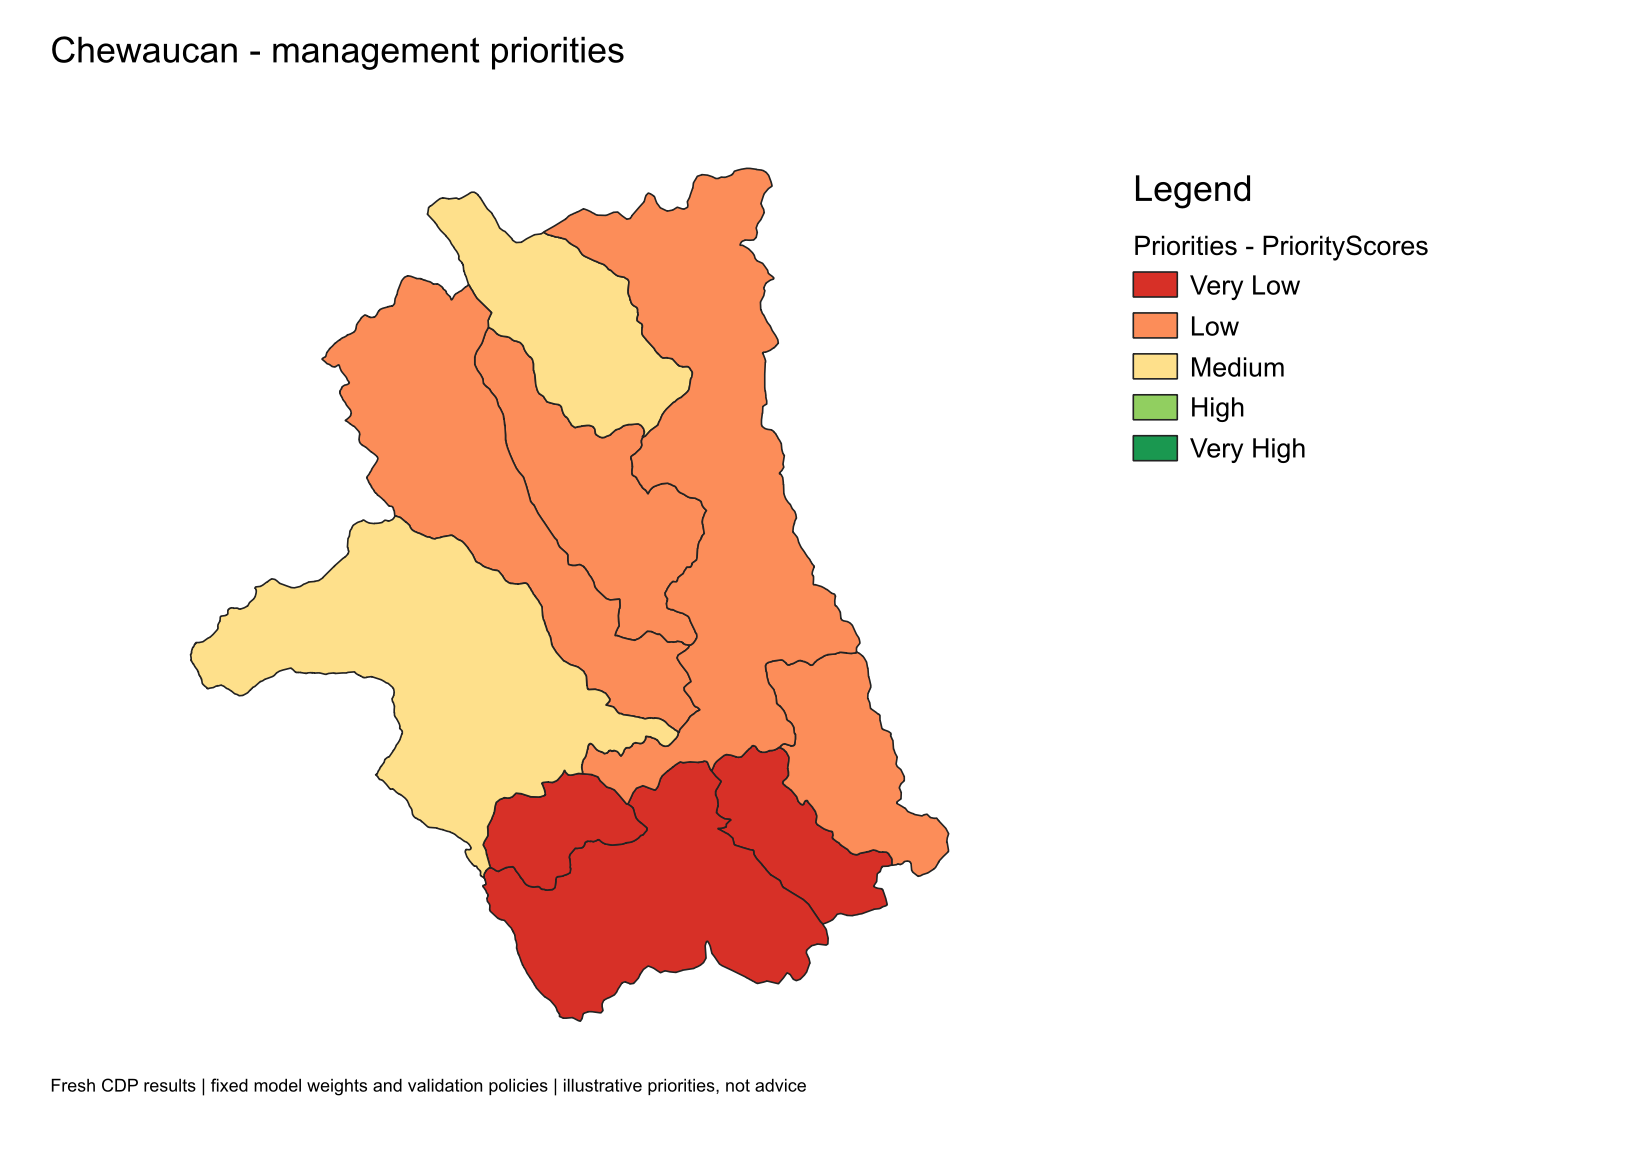
Explore the Chewaucan study area with the chewWS.nw2 knowledge model and the eight-criterion ChewWS2.cdpx prioritization model.
A guide and result checks
Follow the setup and analysis steps, review the exact field mappings, and compare your rerun with the included results by subwatershed.
Two questions, one traceable analysis
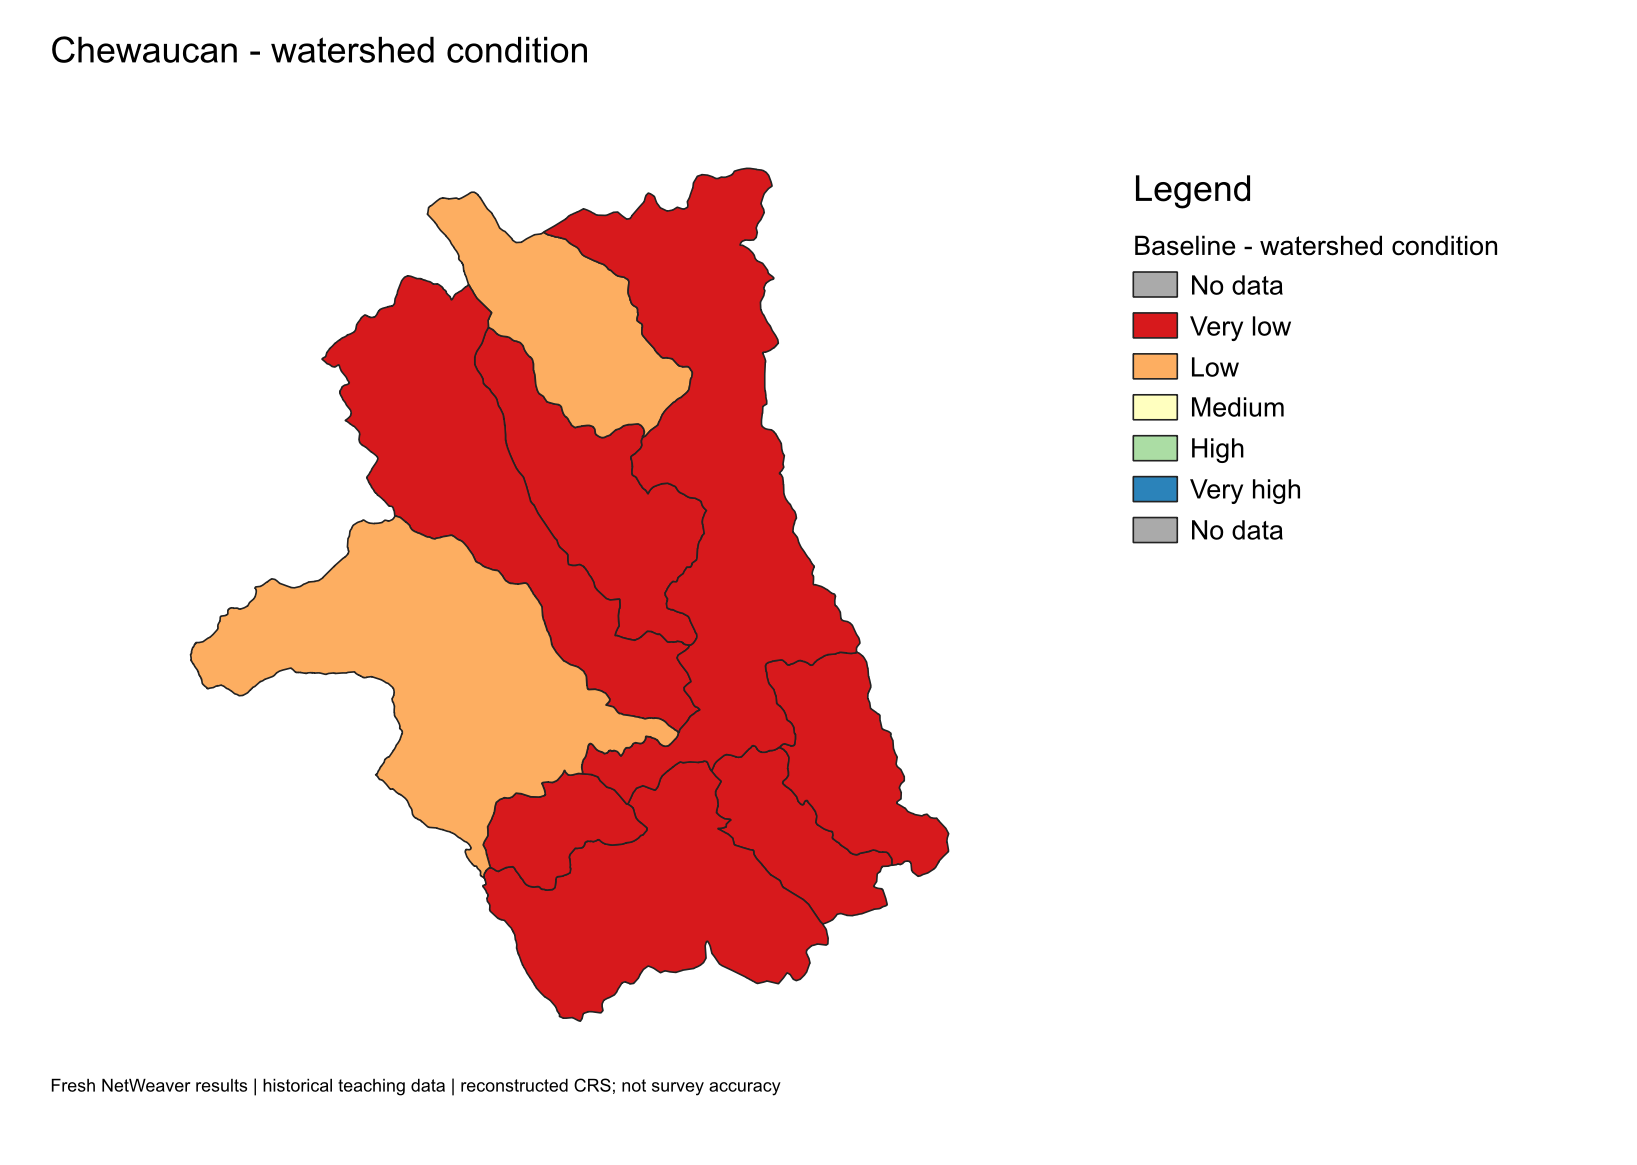 View full-size condition map →
View full-size priority map →
Follow the decision workflow
The full guide is also included in the ZIP, so you can keep the instructions beside your local workspace.
- Install EMDS for QGIS. Choose the package for your operating system and follow its installation instructions.
- Extract and import the example. Unzip the review bundle, then import its
.emdsworkspacefile into a new local folder using EMDS's workspace import. - Explore the study area. Find FullWatershed and confirm that the target layer contains nine named subwatersheds.
- Inspect the condition assessment. Open Watershed Condition → Baseline. Follow the NetWeaver topic values back through the logic network and its source fields.
- Inspect the priorities. Open the Priorities CDP task. Review the eight criterion mappings, weights, and contributions to each subwatershed's score.
- Rerun and compare. Run the NetWeaver parent task before its CDP child, then compare results by subwatershed name and feature key with the included baseline.
Understand the sample before interpreting it
This is a historical teaching dataset for the Upper Chewaucan River basin in Oregon. Its condition and priority scores demonstrate the supplied models; they are not a current assessment of management needs.
The sample uses a reconstructed custom Lambert coordinate system with an assumed NAD83 datum. The recovery notes report approximately 50 metre positional accuracy; this estimate has not been independently verified for this example. Read the included CRS notes before combining it with other spatial data.
The CDP Culverts criterion uses the input_roadCross road-crossing field as a teaching proxy. The guide documents all eight mappings and this assumption.
Sample data and models are included with the owner's permission. The original Chewaucan CDP model attribution to Keith Reynolds is retained in the package.